Experian 2010 Annual Report Download - page 102
Download and view the complete annual report
Please find page 102 of the 2010 Experian annual report below. You can navigate through the pages in the report by either clicking on the pages listed below, or by using the keyword search tool below to find specific information within the annual report.-
 1
1 -
2
-
3
-
4
-
5
-
6
-
7
-
8
-
9
-
10
-
11
-
12
-
13
-
14
-
15
-
16
-
17
-
18
-
19
-
20
-
21
-
22
-
23
-
24
-
25
-
26
-
27
-
28
-
29
-
30
-
31
-
32
-
33
-
34
-
35
-
36
-
37
-
38
-
39
-
40
-
41
-
42
-
43
-
44
-
45
-
46
-
47
-
48
-
49
-
50
-
51
-
52
-
53
-
54
-
55
-
56
-
57
-
58
-
59
-
60
-
61
-
62
-
63
-
64
-
65
-
66
-
67
-
68
-
69
-
70
-
71
-
72
-
73
-
74
-
75
-
76
-
77
-
78
-
79
-
80
-
81
-
82
-
83
-
84
-
85
-
86
-
87
-
88
-
89
-
90
-
91
-
 92
92 -
 93
93 -
 94
94 -
 95
95 -
 96
96 -
 97
97 -
 98
98 -
 99
99 -
 100
100 -
 101
101 -
 102
102 -
 103
103 -
 104
104 -
 105
105 -
 106
106 -
 107
107 -
 108
108 -
 109
109 -
 110
110 -
 111
111 -
 112
112 -
113
-
114
-
115
-
116
-
117
-
118
-
119
-
120
-
121
-
122
-
123
-
124
-
125
-
126
-
127
-
128
-
129
-
130
-
131
-
132
-
133
-
134
-
135
-
136
-
137
-
138
-
139
-
140
-
141
-
142
-
143
-
144
-
145
-
146
-
147
-
148
-
149
-
150
-
151
-
152
-
153
-
154
-
155
-
156
-
157
-
158
-
159
-
160
-
161
-
162
-
163
-
164
 |
 |

Experian Annual Report 2010 Financial statements100
Notes to the Group nancial statements (continued)
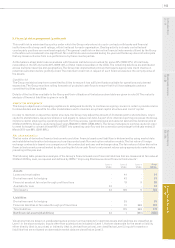
4. Signicant accounting policies (continued)
The key assumptions used for value-in-use calculations are: 2010 2009
CGU
Pre-tax
WACC
Long term
growth rate
Pre-tax
WACC
Long term
growth rate
North America 12.2% 2.3% 11.6% 2.3%
Latin America 15.4% 6.4% 17.0% 8.0%
UK & Ireland 10.5% 2.3% 11.5% 2.3%
EMEA 9.8% 4.3% 12.1% 4.3%
Asia Pacic 11.6% 4.8% 13.5% 4.8%
At 31 March 2010, the recoverable amount of the Latin America CGU exceeds the carrying value by approximately US$500m and
an increase in the pre-tax WACC of 2.6% or a reduction of 4.4% in the long-term growth rate would reduce the value-in-use of
its goodwill to an amount equal to its carrying value. At 31 March 2010, the recoverable amount of the Asia Pacic CGU exceeds
the carrying value by approximately US$100m and an increase in the pre-tax WACC of 3.4% or a reduction of 5.8% in the long-
term growth rate would reduce the value-in-use of its goodwill to an amount equal to its carrying value.
Share-based payments
The Group has a number of equity settled share-based employee incentive plans. The assumptions used in determining the
amounts charged in the Group income statement include judgments in respect of performance conditions and length of service
together with future share prices, dividend and interest yields and exercise patterns.
Critical judgments
Management has made certain judgments in the process of applying the Group’s accounting policies set out above that have
a signicant effect on the amounts recognised in the Group nancial statements. The accounting policy descriptions indicate
where judgment needs exercising and these judgments include the classication of transactions between the Group income
statement and the Group balance sheet.
The most signicant of these judgments is in respect of intangible assets where certain costs incurred in the developmental
phase of an internal project are capitalised if a number of criteria are met. Management has made certain judgments and
assumptions when assessing whether a project meets these criteria, and on measuring the costs and the economic life
attributed to such projects. On acquisition, specic intangible assets are identied and recognised separately from goodwill
and then amortised over their estimated useful lives. These include such items as brand names and customer lists, to which
value is rst attributed at the time of acquisition. The capitalisation of these assets and the related amortisation charges are
based on judgments about the value and economic life of such items. The economic lives for intangible assets are estimated
at between three and ten years for internal projects, which include databases, internal use software and internally generated
software, and between two and twenty years for acquisition intangibles.
Use of non-GAAP measures in the Group nancial statements
The Group has identied certain measures that it believes will assist understanding of the performance of the business. The
measures are not dened under IFRS and they may not be directly comparable with other companies’ adjusted measures.
The non-GAAP measures are not intended to be a substitute for, or superior to, any IFRS measures of performance but
management has included them as they consider them to be important comparables and key measures used within the
business for assessing performance.
The following are the key non-GAAP measures identied by the Group:
Benchmark prot before tax (‘Benchmark PBT’)
Benchmark PBT is dened as prot before amortisation of acquisition intangibles, goodwill impairments, charges in respect
of the demerger-related equity incentive plans, exceptional items, nancing fair value remeasurements, tax and discontinued
operations. It includes the Group’s share of associates’ pre-tax prot.
Earnings before interest and tax (‘EBIT’)
EBIT is dened as prot before amortisation of acquisition intangibles, goodwill impairments, charges in respect of the
demerger-related equity incentive plans, exceptional items, net nance costs, tax and discontinued operations. It includes the
Group’s share of associates’ pre-tax prot.
Benchmark earnings
Benchmark earnings represents Benchmark PBT less attributable tax and minority interests. Benchmark earnings attributable
to minority interests represents that portion of Benchmark earnings that relate to minority interests. Benchmark PBT less
attributable tax is designated as overall benchmark earnings.
Benchmark earnings per share (‘Benchmark EPS’)
Benchmark EPS represents Benchmark earnings divided by the weighted average number of shares in issue, and is disclosed
to indicate the underlying protability of the Group.