Experian 2010 Annual Report Download - page 110
Download and view the complete annual report
Please find page 110 of the 2010 Experian annual report below. You can navigate through the pages in the report by either clicking on the pages listed below, or by using the keyword search tool below to find specific information within the annual report.-
 1
1 -
2
-
3
-
4
-
5
-
6
-
7
-
8
-
9
-
10
-
11
-
12
-
13
-
14
-
15
-
16
-
17
-
18
-
19
-
20
-
21
-
22
-
23
-
24
-
25
-
26
-
27
-
28
-
29
-
30
-
31
-
32
-
33
-
34
-
35
-
36
-
37
-
38
-
39
-
40
-
41
-
42
-
43
-
44
-
45
-
46
-
47
-
48
-
49
-
50
-
51
-
52
-
53
-
54
-
55
-
56
-
57
-
58
-
59
-
60
-
61
-
62
-
63
-
64
-
65
-
66
-
67
-
68
-
69
-
70
-
71
-
72
-
73
-
74
-
75
-
76
-
77
-
78
-
79
-
80
-
81
-
82
-
83
-
84
-
85
-
86
-
87
-
88
-
89
-
90
-
91
-
92
-
93
-
94
-
95
-
96
-
97
-
98
-
99
-
 100
100 -
 101
101 -
 102
102 -
 103
103 -
 104
104 -
 105
105 -
 106
106 -
 107
107 -
 108
108 -
 109
109 -
 110
110 -
 111
111 -
 112
112 -
 113
113 -
 114
114 -
 115
115 -
 116
116 -
 117
117 -
 118
118 -
 119
119 -
 120
120 -
121
-
122
-
123
-
124
-
125
-
126
-
127
-
128
-
129
-
130
-
131
-
132
-
133
-
134
-
135
-
136
-
137
-
138
-
139
-
140
-
141
-
142
-
143
-
144
-
145
-
146
-
147
-
148
-
149
-
150
-
151
-
152
-
153
-
154
-
155
-
156
-
157
-
158
-
159
-
160
-
161
-
162
-
163
-
164
 |
 |

Experian Annual Report 2010 Financial statements108
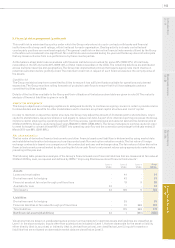
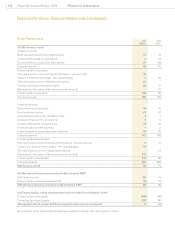
Notes to the Group nancial statements (continued)
6. Segment information (continued)
(iii) Other segment nancial information
Continuing operations1
Year ended 31 March 2010 North
America
US$m
Latin
America
US$m
UK &
Ireland
US$m
EMEA/
Asia
Pacic2
US$m
To t a l
operating
segments
US$m
Central
Activities
US$m
To t a l
Group
US$m
Benchmark PBT is stated after charging:
Depreciation of property, plant and equipment 42 13 19 8 82 3 85
Amortisation of intangible assets (other than
acquisition intangibles) 96 47 28 17 188 1 189
Benchmark PBT includes:
Share of prots of associates 57 - - 1 58 - 58
Capital expenditure 133 65 54 38 290 24 314
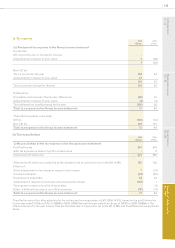
Continuing operations1
Year ended 31 March 2009 North
America
US$m
Latin
America
US$m
UK &
Ireland
US$m
EMEA/
Asia
Pacic2
US$m
Tot a l
operating
segments
US$m
Central
Activities
US$m
Tot a l
Group
US$m
Benchmark PBT is stated after charging:
Depreciation of property, plant and equipment 45 9 24 9 87 3 90
Amortisation of intangible assets (other than
acquisition intangibles) 114 41 32 11 198 - 198
Benchmark PBT includes:
Share of prots of associates 48 - - (4) 44 - 44
Capital expenditure 126 69 52 38 285 20 305
1. In the year ended 31 March 2009, additional depreciation of US$8m, amortisation of US$8m and capital expenditure of US$23m arose in respect of discontinued
operations, which comprised the Group’s transaction processing activities in France (2010: US$nil). Further information on discontinued operations is shown
in note 13.
2. EMEA/Asia Pacic represents all other operating segments.