Experian 2010 Annual Report Download - page 123
Download and view the complete annual report
Please find page 123 of the 2010 Experian annual report below. You can navigate through the pages in the report by either clicking on the pages listed below, or by using the keyword search tool below to find specific information within the annual report.-
 1
1 -
2
-
3
-
4
-
5
-
6
-
7
-
8
-
9
-
10
-
11
-
12
-
13
-
14
-
15
-
16
-
17
-
18
-
19
-
20
-
21
-
22
-
23
-
24
-
25
-
26
-
27
-
28
-
29
-
30
-
31
-
32
-
33
-
34
-
35
-
36
-
37
-
38
-
39
-
40
-
41
-
42
-
43
-
44
-
45
-
46
-
47
-
48
-
49
-
50
-
51
-
52
-
53
-
54
-
55
-
56
-
57
-
58
-
59
-
60
-
61
-
62
-
63
-
64
-
65
-
66
-
67
-
68
-
69
-
70
-
71
-
72
-
73
-
74
-
75
-
76
-
77
-
78
-
79
-
80
-
81
-
82
-
83
-
84
-
85
-
86
-
87
-
88
-
89
-
90
-
91
-
92
-
93
-
94
-
95
-
96
-
97
-
98
-
99
-
100
-
101
-
102
-
103
-
104
-
105
-
106
-
107
-
108
-
109
-
110
-
111
-
112
-
 113
113 -
 114
114 -
 115
115 -
 116
116 -
 117
117 -
 118
118 -
 119
119 -
 120
120 -
 121
121 -
 122
122 -
 123
123 -
 124
124 -
 125
125 -
 126
126 -
 127
127 -
 128
128 -
 129
129 -
 130
130 -
 131
131 -
 132
132 -
 133
133 -
134
-
135
-
136
-
137
-
138
-
139
-
140
-
141
-
142
-
143
-
144
-
145
-
146
-
147
-
148
-
149
-
150
-
151
-
152
-
153
-
154
-
155
-
156
-
157
-
158
-
159
-
160
-
161
-
162
-
163
-
164
 |
 |

121
Introduction
2 – 11
Business review
12 – 51
Governance
52 – 84
Financial statements
85 – 160
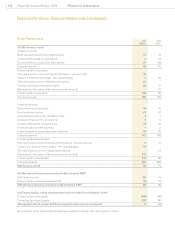
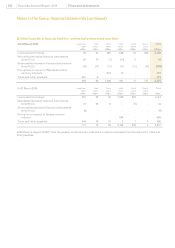
18. Property, plant and equipment
Freehold
properties
US$m
Short
leasehold
properties
US$m
Plant and
equipment
US$m
To t a l
US$m
Cost
At 1 April 2009 272 123 523 918
Differences on exchange 17 - 24 41
Additions through business combinations (note 36(a)) - - 2 2
Other additions 3 1 54 58
Disposal of businesses - - (3) (3)
Other disposals (36) (1) (80) (117)
Transfer in respect of assets held for sale (note 37) - - (4) (4)
At 31 March 2010 256 123 516 895
Depreciation
At 1 April 2009 67 31 341 439
Differences on exchange 2 - 11 13
Charge for the year 7 6 72 85
Disposal of businesses - - (2) (2)
Other disposals (10) (1) (78) (89)
Transfer in respect of assets held for sale (note 37) - - (2) (2)
At 31 March 2010 66 36 342 444
Net Book Value at 31 March 2009 205 92 182 479
Net Book Value at 31 March 2010 190 87 174 451
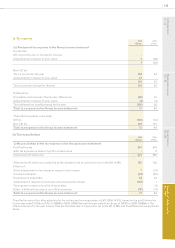
Freehold
properties
US$m
Short
leasehold
properties
US$m
Plant and
equipment
US$m
Tot a l
US$m
Cost
At 1 April 2008 335 122 680 1,137
Differences on exchange (64) - (97) (161)
Additions through business combinations - - 1 1
Other additions 1 2 74 77
Disposal of businesses (2) - (96) (98)
Other disposals (1) (1) (36) (38)
Trans f e r s 3 - (3) -
At 31 March 2009 272 123 523 918
Depreciation
At 1 April 2008 68 26 439 533
Differences on exchange (9) - (64) (73)
Charge for the year 8 6 80 94
Disposal of businesses - - (83) (83)
Disposals - (1) (31) (32)
At 31 March 2009 67 31 341 439
Net Book Value at 31 March 2008 267 96 241 604
Net Book Value at 31 March 2009 205 92 182 479
The net book value of assets held under nance lease agreements and capitalised in plant and equipment is US$8m (2009:
US$9m). At the end of such agreements the Group has the option to purchase the equipment at a benecial price.