Experian 2010 Annual Report Download - page 43
Download and view the complete annual report
Please find page 43 of the 2010 Experian annual report below. You can navigate through the pages in the report by either clicking on the pages listed below, or by using the keyword search tool below to find specific information within the annual report.-
 1
1 -
2
-
3
-
4
-
5
-
6
-
7
-
8
-
9
-
10
-
11
-
12
-
13
-
14
-
15
-
16
-
17
-
18
-
19
-
20
-
21
-
22
-
23
-
24
-
25
-
26
-
27
-
28
-
29
-
30
-
31
-
32
-
 33
33 -
 34
34 -
 35
35 -
 36
36 -
 37
37 -
 38
38 -
 39
39 -
 40
40 -
 41
41 -
 42
42 -
 43
43 -
 44
44 -
 45
45 -
 46
46 -
 47
47 -
 48
48 -
 49
49 -
 50
50 -
 51
51 -
 52
52 -
 53
53 -
54
-
55
-
56
-
57
-
58
-
59
-
60
-
61
-
62
-
63
-
64
-
65
-
66
-
67
-
68
-
69
-
70
-
71
-
72
-
73
-
74
-
75
-
76
-
77
-
78
-
79
-
80
-
81
-
82
-
83
-
84
-
85
-
86
-
87
-
88
-
89
-
90
-
91
-
92
-
93
-
94
-
95
-
96
-
97
-
98
-
99
-
100
-
101
-
102
-
103
-
104
-
105
-
106
-
107
-
108
-
109
-
110
-
111
-
112
-
113
-
114
-
115
-
116
-
117
-
118
-
119
-
120
-
121
-
122
-
123
-
124
-
125
-
126
-
127
-
128
-
129
-
130
-
131
-
132
-
133
-
134
-
135
-
136
-
137
-
138
-
139
-
140
-
141
-
142
-
143
-
144
-
145
-
146
-
147
-
148
-
149
-
150
-
151
-
152
-
153
-
154
-
155
-
156
-
157
-
158
-
159
-
160
-
161
-
162
-
163
-
164
 |
 |
41
Introduction
2 – 11
Governance
52 – 84
Financial statements
85 – 160
Business review
12 – 51
During the year, Eurobonds with a
par value of £203m were redeemed
and a new US$3,000m Euro medium
term note programme was launched.
Under this programme, €500m 4.75%
Guaranteed notes 2020 were issued and
the proceeds swapped into US dollars.
Existing committed bank facilities
run to July 2012 and the £334m 5.625%
Euronotes 2013 are due for redemption
at par in December 2013. Accordingly,
there is no undue concentration of
repayment obligations in respect
of debt instruments. The maturity
prole of loans and borrowings is
shown in note 28 to the Group nancial
statements.
At 31 March 2010, net debt was
US$1,627m (2009: US$2,110m) and
undrawn committed borrowing facilities
totalled US$1,932m (2009: US$1,050m).
There have been no defaults under any
covenants given on loans or borrowings
in the current or prior year and no
onerous covenants were entered into in
connection with the new Euro medium
term note programme.
Share price, net assets and
total equity
The share price of Experian ranged
from a low of 433p to a high of 661p
during the year. On 31 March 2010, the
mid market price was 648.5p, giving a
market capitalisation of US$10.1bn at
that date (2009: US$6.4bn).
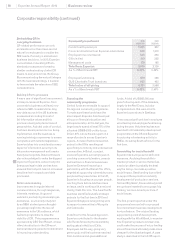
An analysis of net assets is shown in
the table above with further information
by operating segment given in note 6 to
the Group nancial statements.
The Group statement of changes in
total equity, now shown as a primary
statement within the Group nancial
statements, indicates that the increase
of US$538m in total equity is after
actuarial losses of US$28m in respect
of dened benet pension plans
and includes currency translation
gains of US$218m, mainly as a result
of the weakening of the US dollar
against sterling. As required by IAS
1 ‘Amendment – Presentation of
Financial Statements’, these items
are shown net of related tax in the
Group statement of comprehensive
income which is another new primary
statement.
Capital expenditure
Capital expenditure incurred on
continuing activities in 2010 was
US$314m. Such expenditure was
equivalent to 114% of the depreciation
charge for the year (2009: 108%).
FARES
As indicated in note 19 to the Group
nancial statements, Experian received
notice from The First American
Corporation (‘FAC’) in respect of the
exercise by FAC of its buy-out option
over Experian’s 20% interest in FARES
on 22 April 2010 and cash consideration
of some US$314m will be payable to
Experian by 31 December 2010.
Format of nancial information –
Group income statement
As the Group further develops cost
management globally, a new format
is to be adopted in the Group income
statement to report costs by nature
rather than by function in the year
ending 31 March 2011. This will more
appropriately reect the nature of the
cost base.
The only other signicant change
anticipated in the 2011 Group income
statement is that the results of FARES
will be shown as a discontinued
operation in view of the forthcoming
disposal of Experian’s interest during
the year.
Accounting policies, estimates
and assumptions
The principal accounting policies
used are shown in note 4 to the Group
nancial statements. These include
details of critical estimates and
assumptions, the most signicant of
which relate to tax, pension benets,
goodwill and nancial instruments.
The estimates made in respect of
tax assets and liabilities include the
consideration of transactions in the
ordinary course of business for which
the ultimate tax determination is
uncertain.
The recognition of pension obligations
involves the selection of appropriate
actuarial assumptions and changes
therein may impact on the amounts
disclosed in the Group balance sheet
and the Group income statement. At
31 March 2010 the net pension liability
was US$88m (2009: US$58m). This
Net assets summary
At 31 March
2010
US$m
2009
US$m
Goodwill 3,412 3,125
Investment in associates – principally FARES1243 332
Other segment assets 2,382 2,310
Total segment assets 6,037 5,767
Segment liabilities (1,165) (1,060)
Assets and liabilities of operating segments 4,872 4,707
Central Activities – net assets/(liabilities) 40 (78)
Net present value of put option in respect of
Serasa minority (661) (424)
Capital employed 4,251 4,205
Net debt (1,627) (2,110)
Ta x (187) (196)
Net assets 2,437 1,899
US cents US cents
Net assets per share 2.40 1.87
1. Experian will dispose of its investment in FARES for cash during the year ending 31 March 2011.
107
89
87
122
92
130