Experian 2010 Annual Report Download - page 112
Download and view the complete annual report
Please find page 112 of the 2010 Experian annual report below. You can navigate through the pages in the report by either clicking on the pages listed below, or by using the keyword search tool below to find specific information within the annual report.-
 1
1 -
2
-
3
-
4
-
5
-
6
-
7
-
8
-
9
-
10
-
11
-
12
-
13
-
14
-
15
-
16
-
17
-
18
-
19
-
20
-
21
-
22
-
23
-
24
-
25
-
26
-
27
-
28
-
29
-
30
-
31
-
32
-
33
-
34
-
35
-
36
-
37
-
38
-
39
-
40
-
41
-
42
-
43
-
44
-
45
-
46
-
47
-
48
-
49
-
50
-
51
-
52
-
53
-
54
-
55
-
56
-
57
-
58
-
59
-
60
-
61
-
62
-
63
-
64
-
65
-
66
-
67
-
68
-
69
-
70
-
71
-
72
-
73
-
74
-
75
-
76
-
77
-
78
-
79
-
80
-
81
-
82
-
83
-
84
-
85
-
86
-
87
-
88
-
89
-
90
-
91
-
92
-
93
-
94
-
95
-
96
-
97
-
98
-
99
-
100
-
101
-
 102
102 -
 103
103 -
 104
104 -
 105
105 -
 106
106 -
 107
107 -
 108
108 -
 109
109 -
 110
110 -
 111
111 -
 112
112 -
 113
113 -
 114
114 -
 115
115 -
 116
116 -
 117
117 -
 118
118 -
 119
119 -
 120
120 -
 121
121 -
 122
122 -
123
-
124
-
125
-
126
-
127
-
128
-
129
-
130
-
131
-
132
-
133
-
134
-
135
-
136
-
137
-
138
-
139
-
140
-
141
-
142
-
143
-
144
-
145
-
146
-
147
-
148
-
149
-
150
-
151
-
152
-
153
-
154
-
155
-
156
-
157
-
158
-
159
-
160
-
161
-
162
-
163
-
164
 |
 |

Experian Annual Report 2010 Financial statements110
Notes to the Group nancial statements (continued)
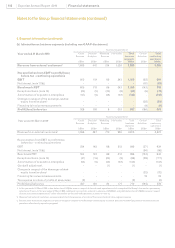
6. Segment information (continued)
(b) Information on business segments (including non-GAAP disclosures)
Continuing operations1
Year ended 31 March 2010 Credit
Services
US$m
Decision
Analytics
US$m
Marketing
Services
US$m
Interactive
US$m
To t a l
business
segments
US$m
Central
Activities
US$m
To t a l
continuing
operations
US$m
Revenue from external customers21,669 441 734 1,036 3,880 - 3,880
Reconciliation from EBIT to prot/(loss)
before tax - continuing operations
EBIT 605 119 86 243 1,053 (62) 991
Net interest (note 11(b)) - - - - - (81) (81)
Benchmark PBT 605 119 86 243 1,053 (143) 910
Exceptional items (note 10) (20) (5) (33) (8) (66) (6) (72)
Amortisation of acquisition intangibles (57) (6) (45) (32) (140) - (140)
Charges in respect of the demerger-related
equity incentive plans3- - - - - (28) (28)
Financing fair value remeasurements - - - - - (9) (9)
Prot/(loss) before tax 528 108 8 203 847 (186) 661
Continuing operations1
Year ended 31 March 2009 Credit
Services
US$m
Decision
Analytics
US$m
Marketing
Services
US$m
Interactive
US$m
Tot a l
business
segments
US$m
Central
Activities
US$m
Tot a l
continuing
operations
US$m
Revenue from external customers21,666 487 770 950 3,873 - 3,873
Reconciliation from EBIT to prot/(loss)
before tax - continuing operations
EBIT 554 142 88 212 996 (57) 939
Net interest (note 11(b)) - - - - - (96) (96)
Benchmark PBT 554 142 88 212 996 (153) 843
Exceptional items (note 10) (41) (16) (23) (9) (89) (28) (117)
Amortisation of acquisition intangibles (54) (6) (40) (32) (132) - (132)
Goodwill adjustment - - (1) - (1) - (1)
Charges in respect of the demerger-related
equity incentive plans3- - - - - (32) (32)
Financing fair value remeasurements - - - - - 19 19
Tax expense on share of prots of associates (2) - - - (2) - (2)
Prot/(loss) before tax 457 120 24 171 772 (194) 578
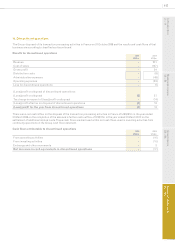
1. In the year ended 31 March 2010, a loss before tax of US$8m arose in respect of discontinued operations, which comprised the Group’s transaction processing
activities in France. In the year ended 31 March 2009, additional revenue from external customers of US$201m and prot before tax of US$26m arose in respect
of these discontinued operations. Further information on discontinued operations is shown in note 13.
2. Revenue from external customers arose principally from the provision of services. There is no material inter-segment revenue.
3. No allocation by business segment is made for charges in respect of the demerger-related equity incentive plans as the underlying data is maintained only to
provide an allocation by operating segment.