Experian 2010 Annual Report Download - page 109
Download and view the complete annual report
Please find page 109 of the 2010 Experian annual report below. You can navigate through the pages in the report by either clicking on the pages listed below, or by using the keyword search tool below to find specific information within the annual report.-
 1
1 -
2
-
3
-
4
-
5
-
6
-
7
-
8
-
9
-
10
-
11
-
12
-
13
-
14
-
15
-
16
-
17
-
18
-
19
-
20
-
21
-
22
-
23
-
24
-
25
-
26
-
27
-
28
-
29
-
30
-
31
-
32
-
33
-
34
-
35
-
36
-
37
-
38
-
39
-
40
-
41
-
42
-
43
-
44
-
45
-
46
-
47
-
48
-
49
-
50
-
51
-
52
-
53
-
54
-
55
-
56
-
57
-
58
-
59
-
60
-
61
-
62
-
63
-
64
-
65
-
66
-
67
-
68
-
69
-
70
-
71
-
72
-
73
-
74
-
75
-
76
-
77
-
78
-
79
-
80
-
81
-
82
-
83
-
84
-
85
-
86
-
87
-
88
-
89
-
90
-
91
-
92
-
93
-
94
-
95
-
96
-
97
-
98
-
 99
99 -
 100
100 -
 101
101 -
 102
102 -
 103
103 -
 104
104 -
 105
105 -
 106
106 -
 107
107 -
 108
108 -
 109
109 -
 110
110 -
 111
111 -
 112
112 -
 113
113 -
 114
114 -
 115
115 -
 116
116 -
 117
117 -
 118
118 -
 119
119 -
120
-
121
-
122
-
123
-
124
-
125
-
126
-
127
-
128
-
129
-
130
-
131
-
132
-
133
-
134
-
135
-
136
-
137
-
138
-
139
-
140
-
141
-
142
-
143
-
144
-
145
-
146
-
147
-
148
-
149
-
150
-
151
-
152
-
153
-
154
-
155
-
156
-
157
-
158
-
159
-
160
-
161
-
162
-
163
-
164
 |
 |

107
Introduction
2 – 11
Business review
12 – 51
Governance
52 – 84
Financial statements
85 – 160
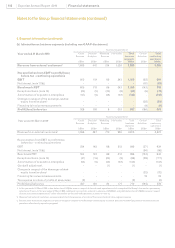
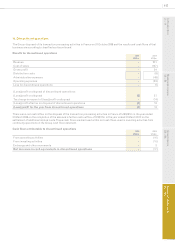
6. Segment information (continued)
(ii) Balance sheet
At 31 March 2010 North
America
US$m
Latin
America
US$m
UK &
Ireland
US$m
EMEA/
Asia
Pacic1
US$m
Segment
assets and
liabilities
US$m
Central
Activities
and other2
US$m
To t a l
Group
US$m
Goodwill 1,531 1,017 570 294 3,412 - 3,412
Investments in associates 216 - - 27 243 - 243
Other assets 915 704 415 348 2,382 641 3,023
Total assets 2,662 1,721 985 669 6,037 641 6,678
Total liabilities (449) (155) (345) (216) (1,165) (3,076) (4,241)
Net assets/(liabilities) 2,213 1,566 640 453 4,872 (2,435) 2,437
At 31 March 2009 North
America
US$m
Latin
America
US$m
UK &
Ireland
US$m
EMEA/
Asia
Pacic1
US$m
Segment
assets and
liabilities
US$m
Central
Activities
and other2
US$m
Tot a l
Group
US$m
Goodwill 1,534 789 544 258 3,125 - 3,125
Investments in associates 313 - - 19 332 - 332
Other assets 1,012 567 432 299 2,310 372 2,682
Total assets 2,859 1,356 976 576 5,767 372 6,139
Total liabilities (444) (123) (268) (225) (1,060) (3,18 0) (4,240)
Net assets/(liabilities) 2,415 1,233 708 351 4,707 (2,808) 1,899
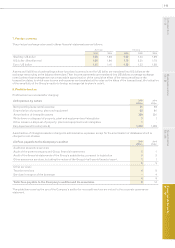
2010 2009
Central Activities and other comprise: Assets
US$m
Liabilities
US$m
Net assets/
(liabilities)
US$m
Assets
US$m
Liabilities
US$m
Net assets/
(liabilities)
US$m
Central Activities – total segment assets 203 - 203 143 - 143
Central Activities – total segment liabilities - (163) (163) - (221) (221)
Central Activities – net assets/(liabilities) 203 (163) 40 143 (221) (78)
Net present value of put option in respect of
Serasa minority interest - (661) (661) - (424) (424)
Net debt 258 (1,885) (1,627) 199 (2,309) (2,110)
Ta x 180 (367) (187) 30 (226) (196)
Central Activities and other 641 (3,076) (2,435) 372 (3,180) (2,808)
1. EMEA/Asia Pacic represents all other operating segments.
2. Net assets/(liabilities) for Central Activities comprise corporate head ofce balances including retirement benet obligations and derivative assets and
liabilities.