Experian 2010 Annual Report Download - page 18
Download and view the complete annual report
Please find page 18 of the 2010 Experian annual report below. You can navigate through the pages in the report by either clicking on the pages listed below, or by using the keyword search tool below to find specific information within the annual report.-
 1
1 -
2
-
3
-
4
-
5
-
6
-
7
-
 8
8 -
 9
9 -
 10
10 -
 11
11 -
 12
12 -
 13
13 -
 14
14 -
 15
15 -
 16
16 -
 17
17 -
 18
18 -
 19
19 -
 20
20 -
 21
21 -
 22
22 -
 23
23 -
 24
24 -
 25
25 -
 26
26 -
 27
27 -
 28
28 -
29
-
30
-
31
-
32
-
33
-
34
-
35
-
36
-
37
-
38
-
39
-
40
-
41
-
42
-
43
-
44
-
45
-
46
-
47
-
48
-
49
-
50
-
51
-
52
-
53
-
54
-
55
-
56
-
57
-
58
-
59
-
60
-
61
-
62
-
63
-
64
-
65
-
66
-
67
-
68
-
69
-
70
-
71
-
72
-
73
-
74
-
75
-
76
-
77
-
78
-
79
-
80
-
81
-
82
-
83
-
84
-
85
-
86
-
87
-
88
-
89
-
90
-
91
-
92
-
93
-
94
-
95
-
96
-
97
-
98
-
99
-
100
-
101
-
102
-
103
-
104
-
105
-
106
-
107
-
108
-
109
-
110
-
111
-
112
-
113
-
114
-
115
-
116
-
117
-
118
-
119
-
120
-
121
-
122
-
123
-
124
-
125
-
126
-
127
-
128
-
129
-
130
-
131
-
132
-
133
-
134
-
135
-
136
-
137
-
138
-
139
-
140
-
141
-
142
-
143
-
144
-
145
-
146
-
147
-
148
-
149
-
150
-
151
-
152
-
153
-
154
-
155
-
156
-
157
-
158
-
159
-
160
-
161
-
162
-
163
-
164
 |
 |

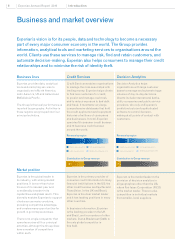
Experian Annual Report 2010 Business review16
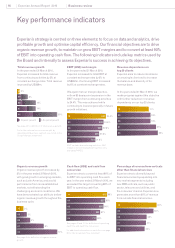
Key performance indicators
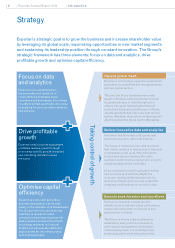
Experian’s strategy is centred on three elements: to focus on data and analytics, drive
protable growth and optimise capital efciency. Our nancial objectives are to drive
organic revenue growth, to maintain or grow EBIT margins and to convert at least 90%
of EBIT into operating cash ow. The following indicators include key metrics used by
the Board and internally to assess Experian’s success in achieving its objectives.
Cash flow (US$) and cash flow
conversion
Experian aims to convert at least 90% of
its EBIT into operating cash ow each
year. In the year ended 31 March 2010, we
exceeded this target converting 98% of
EBIT to operating cash ow.
See pages 40 and 101 for denition of operating
cash ow and cash ow conversion.
For additional information on cash ow see page
90 for the Group cash ow statement.
Organic revenue growth
Organic revenue growth increased by
2% in the year ended 31 March 2010,
with good growth in emerging markets,
such as Latin America, and a solid
performance from more established
markets, notwithstanding the
challenging economic conditions. We
have demonstrated our ability to deliver
organic revenue growth throughout the
business cycle.
See page 45 for denition of organic revenue
growth.
2%
10
3%
09
4%
08
8%
07
12%
06
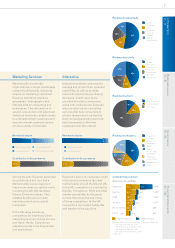
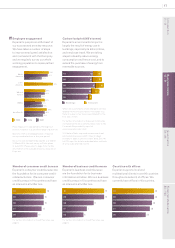
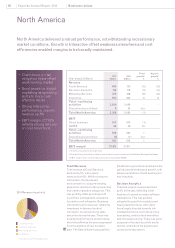
Percentage of revenue from verticals
other than financial services
Experian aims to diversify beyond
nancial services by expanding into
new market segments including
new B2B verticals, such as public
sector, telecoms and utilities, and
the consumer channel. Experian now
generates more than 60% of revenue
from outside nancial services.
98%
10 976
99%
09 927
98%
08 886
97%
07 804
99%
06 717
64%
10
48%
08
59%
09
47%
07
45%
06
EBIT (US$) and margin
In the year ended 31 March 2010,
Experian increased its total EBIT at
constant exchange rates by 6% to
US$991m. Continuing EBIT increased
by 6% at constant exchange rates.
We again met our margin objective,
with an 80 basis point expansion in the
EBIT margin from continuing activities
to 24.4%. This was achieved while
continuing to invest organically in future
growth initiatives.
Total revenue growth
In the year ended 31 March 2010,
Experian increased its total revenue
from continuing activities by 2% at
constant exchange rates. Total revenue
improved by US$69m.
See page 45 for denition of total revenue growth.
For further information on revenue split by
operating and business segment, see note 6 in the
Group nancial statements.
Organic growth Acquired growth
EBIT includes discontinuing activities. EBIT
margin is for continuing direct business only,
excluding FARES.
24.4%
10 991
23.6%
22.8%
21.9%
21.0%
09 939
08 908
07 825
06 727
10 2%
14%
14%
08
07
8%
09
Revenue dependence on
top 20 clients
Experian aims to reduce its reliance
on any single client and to increase
the balance and diversity of its
revenue base.
In the year ended 31 March 2010, we
made progress against this objective
with further reduction in revenue
dependency on our top 20 clients.
17%10
18%09
18%08
21%07
06 22%
06 30%