Experian 2010 Annual Report Download - page 88
Download and view the complete annual report
Please find page 88 of the 2010 Experian annual report below. You can navigate through the pages in the report by either clicking on the pages listed below, or by using the keyword search tool below to find specific information within the annual report.-
 1
1 -
2
-
3
-
4
-
5
-
6
-
7
-
8
-
9
-
10
-
11
-
12
-
13
-
14
-
15
-
16
-
17
-
18
-
19
-
20
-
21
-
22
-
23
-
24
-
25
-
26
-
27
-
28
-
29
-
30
-
31
-
32
-
33
-
34
-
35
-
36
-
37
-
38
-
39
-
40
-
41
-
42
-
43
-
44
-
45
-
46
-
47
-
48
-
49
-
50
-
51
-
52
-
53
-
54
-
55
-
56
-
57
-
58
-
59
-
60
-
61
-
62
-
63
-
64
-
65
-
66
-
67
-
68
-
69
-
70
-
71
-
72
-
73
-
74
-
75
-
76
-
77
-
 78
78 -
 79
79 -
 80
80 -
 81
81 -
 82
82 -
 83
83 -
 84
84 -
 85
85 -
 86
86 -
 87
87 -
 88
88 -
 89
89 -
 90
90 -
 91
91 -
 92
92 -
 93
93 -
 94
94 -
 95
95 -
 96
96 -
 97
97 -
 98
98 -
99
-
100
-
101
-
102
-
103
-
104
-
105
-
106
-
107
-
108
-
109
-
110
-
111
-
112
-
113
-
114
-
115
-
116
-
117
-
118
-
119
-
120
-
121
-
122
-
123
-
124
-
125
-
126
-
127
-
128
-
129
-
130
-
131
-
132
-
133
-
134
-
135
-
136
-
137
-
138
-
139
-
140
-
141
-
142
-
143
-
144
-
145
-
146
-
147
-
148
-
149
-
150
-
151
-
152
-
153
-
154
-
155
-
156
-
157
-
158
-
159
-
160
-
161
-
162
-
163
-
164
 |
 |

Experian Annual Report 2010 Financial statements86
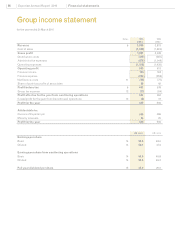
Group income statement
for the year ended 31 March 2010
Notes 2010
US$m
2009
US$m
Revenue 63,880 3,873
Cost of sales (1,889) (1,824)
Gross prot 1,991 2,049
Distribution costs (419) (387)
Administrative expenses (879) (1,049)
Operating expenses (1,298) (1,436)
Operating prot 693 613
Finance income 196 182
Finance expense (286) (259)
Net nance costs 11 (90) (77)
Share of post-tax prots of associates 58 42
Prot before tax 6661 578
Group tax expense 12 (17) (84)
Prot after tax for the year from continuing operations 644 494
(Loss)/prot for the year from discontinued operations 13 (8) 12
Prot for the year 636 506
Attributable to:
Owners of Experian plc 600 486
Minority interests 36 20
Prot for the year 636 506
US cents US cents
Earnings per share
Basic 14 59.0 48.0
Diluted 14 58.1 47.5
Earnings per share from continuing operations
Basic 14 59.8 46.8
Diluted 14 58.9 46.3
Full year dividend per share 15 23.0 20.0