Experian 2010 Annual Report Download - page 114
Download and view the complete annual report
Please find page 114 of the 2010 Experian annual report below. You can navigate through the pages in the report by either clicking on the pages listed below, or by using the keyword search tool below to find specific information within the annual report.-
 1
1 -
2
-
3
-
4
-
5
-
6
-
7
-
8
-
9
-
10
-
11
-
12
-
13
-
14
-
15
-
16
-
17
-
18
-
19
-
20
-
21
-
22
-
23
-
24
-
25
-
26
-
27
-
28
-
29
-
30
-
31
-
32
-
33
-
34
-
35
-
36
-
37
-
38
-
39
-
40
-
41
-
42
-
43
-
44
-
45
-
46
-
47
-
48
-
49
-
50
-
51
-
52
-
53
-
54
-
55
-
56
-
57
-
58
-
59
-
60
-
61
-
62
-
63
-
64
-
65
-
66
-
67
-
68
-
69
-
70
-
71
-
72
-
73
-
74
-
75
-
76
-
77
-
78
-
79
-
80
-
81
-
82
-
83
-
84
-
85
-
86
-
87
-
88
-
89
-
90
-
91
-
92
-
93
-
94
-
95
-
96
-
97
-
98
-
99
-
100
-
101
-
102
-
103
-
 104
104 -
 105
105 -
 106
106 -
 107
107 -
 108
108 -
 109
109 -
 110
110 -
 111
111 -
 112
112 -
 113
113 -
 114
114 -
 115
115 -
 116
116 -
 117
117 -
 118
118 -
 119
119 -
 120
120 -
 121
121 -
 122
122 -
 123
123 -
 124
124 -
125
-
126
-
127
-
128
-
129
-
130
-
131
-
132
-
133
-
134
-
135
-
136
-
137
-
138
-
139
-
140
-
141
-
142
-
143
-
144
-
145
-
146
-
147
-
148
-
149
-
150
-
151
-
152
-
153
-
154
-
155
-
156
-
157
-
158
-
159
-
160
-
161
-
162
-
163
-
164
 |
 |

Experian Annual Report 2010 Financial statements112
Notes to the Group nancial statements (continued)
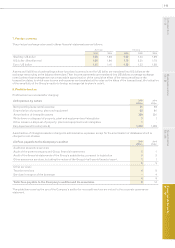
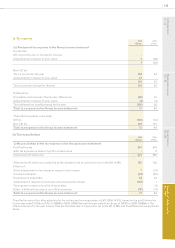
Remuneration of key management personnel
2010
US$m
2009
US$m
Salaries and short-term employee benets 12 12
Retirement benets 1 1
Share-based payments 13 13
Total continuing operations 26 26
Key management personnel comprises the board of directors. The amount included in respect of share-based payments includes
operating and exceptional costs for previous GUS awards and the one-off demerger awards. Further details of directors'
remuneration are given in the audited part of the report on directors’ remuneration.
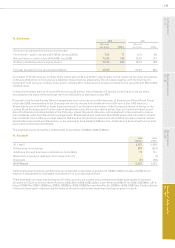
10. Exceptional and other non-GAAP measures
2010
US$m
2009
US$m
Exceptional items
Restructuring costs 41 92
Loss arising in connection with arrangements with FARES 4 -
Cessation of bureau activities 3 15
Loss on disposal of businesses 24 3
Demerger and related restructuring costs - 7
Total exceptional items 72 117
Other non-GAAP measures
Amortisation of acquisition intangibles 140 132
Goodwill adjustment - 1
Charges in respect of the demerger-related equity incentive plans 28 32
Financing fair value remeasurements (note 11) 9(19)
Total other non-GAAP measures 177 146
Exceptional items and other non-GAAP measures are in respect of continuing operations. Exceptional items are charged to
administrative expenses.
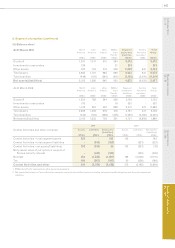
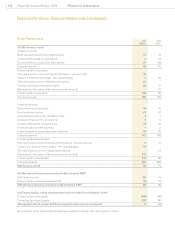
9. Employee benet costs and employee numbers
Aggregate employee costs for the continuing operations of the Group
Notes 2010
US$m
2009
US$m
Wages and salaries 1,158 1,163
Social security costs 165 165
Share-based payments 29 63 55
Pension costs - dened benet plans 30 10 10
Pension costs - dened contribution plans 34 35
Total continuing operations 1,430 1,428
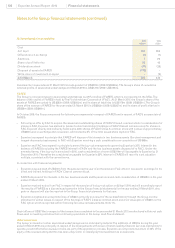
Average number of employees (including executive directors) in the continuing operations of the Group
2010 2009
Full time Part time Full time
equivalent
Full time Part time Full time
equivalent
North America 5,480 145 5,553 5,768 302 5,919
Latin America 2,548 82 2,589 2,355 228 2,469
UK & Ireland 3,389 157 3,468 3,549 99 3,599
EMEA/Asia Pacic 2,938 99 2,988 2,575 104 2,627
Total operating segments 14,355 483 14,598 14,247 733 14,614
Central Activities 90 3 92 85 3 87
Total continuing operations 14,445 486 14,690 14,332 736 14,701