Experian 2010 Annual Report Download - page 111
Download and view the complete annual report
Please find page 111 of the 2010 Experian annual report below. You can navigate through the pages in the report by either clicking on the pages listed below, or by using the keyword search tool below to find specific information within the annual report.-
 1
1 -
2
-
3
-
4
-
5
-
6
-
7
-
8
-
9
-
10
-
11
-
12
-
13
-
14
-
15
-
16
-
17
-
18
-
19
-
20
-
21
-
22
-
23
-
24
-
25
-
26
-
27
-
28
-
29
-
30
-
31
-
32
-
33
-
34
-
35
-
36
-
37
-
38
-
39
-
40
-
41
-
42
-
43
-
44
-
45
-
46
-
47
-
48
-
49
-
50
-
51
-
52
-
53
-
54
-
55
-
56
-
57
-
58
-
59
-
60
-
61
-
62
-
63
-
64
-
65
-
66
-
67
-
68
-
69
-
70
-
71
-
72
-
73
-
74
-
75
-
76
-
77
-
78
-
79
-
80
-
81
-
82
-
83
-
84
-
85
-
86
-
87
-
88
-
89
-
90
-
91
-
92
-
93
-
94
-
95
-
96
-
97
-
98
-
99
-
100
-
 101
101 -
 102
102 -
 103
103 -
 104
104 -
 105
105 -
 106
106 -
 107
107 -
 108
108 -
 109
109 -
 110
110 -
 111
111 -
 112
112 -
 113
113 -
 114
114 -
 115
115 -
 116
116 -
 117
117 -
 118
118 -
 119
119 -
 120
120 -
 121
121 -
122
-
123
-
124
-
125
-
126
-
127
-
128
-
129
-
130
-
131
-
132
-
133
-
134
-
135
-
136
-
137
-
138
-
139
-
140
-
141
-
142
-
143
-
144
-
145
-
146
-
147
-
148
-
149
-
150
-
151
-
152
-
153
-
154
-
155
-
156
-
157
-
158
-
159
-
160
-
161
-
162
-
163
-
164
 |
 |

109
Introduction
2 – 11
Business review
12 – 51
Governance
52 – 84
Financial statements
85 – 160
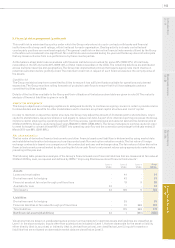
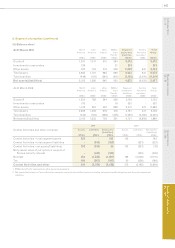
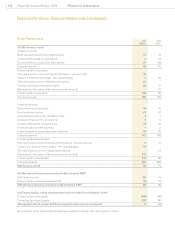
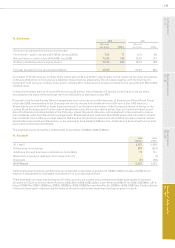
6. Segment information (continued)
(iv) Revenue by country – continuing operations 2010
US$m
2009
US$m
USA 2,064 2,079
UK 784 893
Brazil 556 457
Other 476 444
Total 3,880 3,873
1. No single customer accounted for 10% or more of the Group’s revenue from external customers in the year ended 31 March 2010 and the year ended
31 March 2009.
2. The Company is resident in Ireland. Revenue with Irish external customers represents less than 1% of the Group’s revenue from external customers and
accordingly all the Group’s revenue is attributable to foreign countries.
(v) Revenue by business segment – continuing operations
The analysis by business segment of revenue from external customers is given within note 6(b).
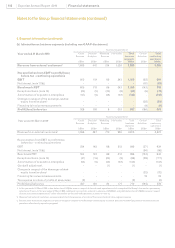
(vi) Non-current assets by country 2010
US$m
2009
US$m
USA 2,340 2,541
UK 751 779
Brazil 1,593 1,265
Other 550 490
Segment non-current assets 5,234 5,075
Central Activities 234 142
Deferred tax 176 13
Total 5,644 5,230
1. Non-current assets for Central Activities and deferred tax have been excluded from the analysis by country to add clarity to the presentation of this
information.
2. The Group has no signicant non-current assets located in Ireland.