Experian 2010 Annual Report Download - page 113
Download and view the complete annual report
Please find page 113 of the 2010 Experian annual report below. You can navigate through the pages in the report by either clicking on the pages listed below, or by using the keyword search tool below to find specific information within the annual report.-
 1
1 -
2
-
3
-
4
-
5
-
6
-
7
-
8
-
9
-
10
-
11
-
12
-
13
-
14
-
15
-
16
-
17
-
18
-
19
-
20
-
21
-
22
-
23
-
24
-
25
-
26
-
27
-
28
-
29
-
30
-
31
-
32
-
33
-
34
-
35
-
36
-
37
-
38
-
39
-
40
-
41
-
42
-
43
-
44
-
45
-
46
-
47
-
48
-
49
-
50
-
51
-
52
-
53
-
54
-
55
-
56
-
57
-
58
-
59
-
60
-
61
-
62
-
63
-
64
-
65
-
66
-
67
-
68
-
69
-
70
-
71
-
72
-
73
-
74
-
75
-
76
-
77
-
78
-
79
-
80
-
81
-
82
-
83
-
84
-
85
-
86
-
87
-
88
-
89
-
90
-
91
-
92
-
93
-
94
-
95
-
96
-
97
-
98
-
99
-
100
-
101
-
102
-
 103
103 -
 104
104 -
 105
105 -
 106
106 -
 107
107 -
 108
108 -
 109
109 -
 110
110 -
 111
111 -
 112
112 -
 113
113 -
 114
114 -
 115
115 -
 116
116 -
 117
117 -
 118
118 -
 119
119 -
 120
120 -
 121
121 -
 122
122 -
 123
123 -
124
-
125
-
126
-
127
-
128
-
129
-
130
-
131
-
132
-
133
-
134
-
135
-
136
-
137
-
138
-
139
-
140
-
141
-
142
-
143
-
144
-
145
-
146
-
147
-
148
-
149
-
150
-
151
-
152
-
153
-
154
-
155
-
156
-
157
-
158
-
159
-
160
-
161
-
162
-
163
-
164
 |
 |

111
Introduction
2 – 11
Business review
12 – 51
Governance
52 – 84
Financial statements
85 – 160
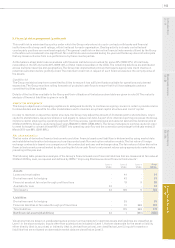
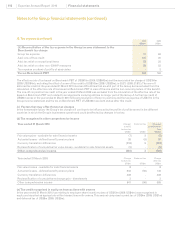
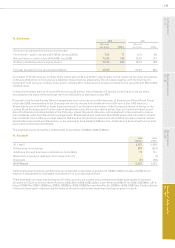
7. Foreign currency
The principal exchange rates used in these nancial statements are as follows:
Average Closing
2010 2009 2010 2009 2008
Sterling : US dollar 1.58 1.69 1.52 1.43 1.99
US dollar : Brazilian real 1.88 1.96 1.79 2.30 1.75
Euro : US dollar 1.41 1.41 1.35 1.33 1.58
Assets and liabilities of undertakings whose functional currency is not the US dollar are translated into US dollars at the
exchange rates ruling at the balance sheet date. Their income statements are translated into US dollars at average exchange
rates (unless these averages are not a reasonable approximation of the cumulative effect of the rates prevailing on the
transaction dates, in which case income and expenses are translated at the rates on the dates of the transactions). An indication
of the sensitivity of the Group’s results to foreign exchange risk is given in note 5.
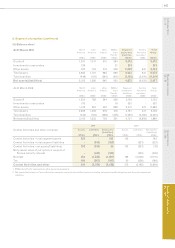
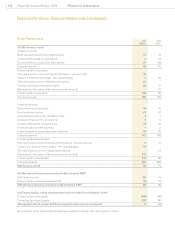
8. Prot before tax
Prot before tax is stated after charging:
(i) Expenses by nature 2010
US$m
2009
US$m
Net operating lease rental expense 51 59
Depreciation of property, plant and equipment 85 90
Amortisation of intangible assets 329 330
Write down on disposal of property, plant and equipment and intangibles 3 1
Other losses on disposal of property, plant and equipment and intangibles 1 -
Employee benet costs (note 9) 1,430 1,428
Amortisation of intangible assets is charged to administrative expenses, except for the amortisation of databases which is
charged to cost of sales.
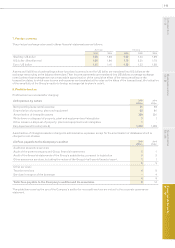
(ii) Fees payable to the Company’s auditor 2010
US$m
2009
US$m
Audit and assurance services:
Audit of the parent company and Group nancial statements 1 1
Audit of the nancial statements of the Group’s subsidiaries, pursuant to legislation 3 3
Other assurance services, including the review of the Group’s half-yearly nancial report 1 1
5 5
Other services:
Taxation services 4 5
Services in respect of the demerger - 4
4 9
Total fees payable to the Company’s auditor and its associates 9 14
The guidelines covering the use of the Company’s auditor for non-audit services are set out in the corporate governance
statement.