Experian 2010 Annual Report Download - page 139
Download and view the complete annual report
Please find page 139 of the 2010 Experian annual report below. You can navigate through the pages in the report by either clicking on the pages listed below, or by using the keyword search tool below to find specific information within the annual report.-
 1
1 -
2
-
3
-
4
-
5
-
6
-
7
-
8
-
9
-
10
-
11
-
12
-
13
-
14
-
15
-
16
-
17
-
18
-
19
-
20
-
21
-
22
-
23
-
24
-
25
-
26
-
27
-
28
-
29
-
30
-
31
-
32
-
33
-
34
-
35
-
36
-
37
-
38
-
39
-
40
-
41
-
42
-
43
-
44
-
45
-
46
-
47
-
48
-
49
-
50
-
51
-
52
-
53
-
54
-
55
-
56
-
57
-
58
-
59
-
60
-
61
-
62
-
63
-
64
-
65
-
66
-
67
-
68
-
69
-
70
-
71
-
72
-
73
-
74
-
75
-
76
-
77
-
78
-
79
-
80
-
81
-
82
-
83
-
84
-
85
-
86
-
87
-
88
-
89
-
90
-
91
-
92
-
93
-
94
-
95
-
96
-
97
-
98
-
99
-
100
-
101
-
102
-
103
-
104
-
105
-
106
-
107
-
108
-
109
-
110
-
111
-
112
-
113
-
114
-
115
-
116
-
117
-
118
-
119
-
120
-
121
-
122
-
123
-
124
-
125
-
126
-
127
-
128
-
 129
129 -
 130
130 -
 131
131 -
 132
132 -
 133
133 -
 134
134 -
 135
135 -
 136
136 -
 137
137 -
 138
138 -
 139
139 -
 140
140 -
 141
141 -
 142
142 -
 143
143 -
 144
144 -
 145
145 -
 146
146 -
 147
147 -
 148
148 -
 149
149 -
150
-
151
-
152
-
153
-
154
-
155
-
156
-
157
-
158
-
159
-
160
-
161
-
162
-
163
-
164
 |
 |

137
Introduction
2 – 11
Business review
12 – 51
Governance
52 – 84
Financial statements
85 – 160
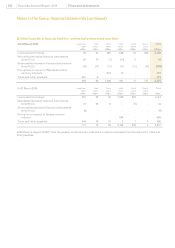
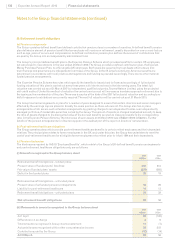
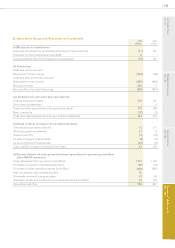
30. Retirement benet obligations (continued)
(iii) Movement in the present value of the total dened benet obligations
2010
US$m
2009
US$m
At 1 April 653 913
Differences on exchange 28 (252)
Current service cost 10 13
Interest on plans’ liabilities 48 52
Settlement or curtailment - (3)
Actuarial losses/(gains) on liabilities 206 (34)
Contributions paid by employees 4 4
Benets paid (39) (40)
At 31 March 910 653
The total dened benet obligations of US$910m (2009: US$653m) include US$860m (2009: US$614m) in respect of the Group’s
funded arrangements and US$50m (2009: US$39m) in respect of the Group’s unfunded arrangements.
(iv) Movement in the fair value of the plans’ assets
2010
US$m
2009
US$m
At 1 April 595 1,045
Differences on exchange 25 (261)
Expected return on plans’ assets 47 69
Actuarial gains/(losses) on assets 178 (236)
Contributions paid by the Group 12 14
Contributions paid by employees 4 4
Benets paid (39) (40)
At 31 March 822 595
The actual return on plans’ assets was a gain of US$225m (2009: loss of US$167m).
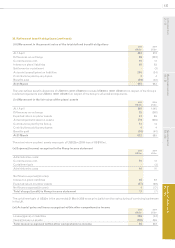
(v) Expense/(income) recognised in the Group income statement
2010
US$m
2009
US$m
Administrative costs:
Current service cost 10 13
Curtailment gain - (3)
Administrative costs 10 10
Net nance expense/(income):
Interest on plans’ liabilities 48 52
Expected return on plans’ assets (47) (69)
Net nance expense/(income) 1 (17)
Total charge/(credit) to Group income statement 11 (7)
The curtailment gain of US$3m in the year ended 31 March 2009 arose principally from the restructuring of continuing businesses
in the UK.
(vi) Actuarial gains and losses recognised within other comprehensive income
2010
US$m
2009
US$m
Losses/(gains) on liabilities 206 (34)
(Gains)/losses on assets (178) 236
Total losses recognised within other comprehensive income 28 202