Experian 2010 Annual Report Download - page 127
Download and view the complete annual report
Please find page 127 of the 2010 Experian annual report below. You can navigate through the pages in the report by either clicking on the pages listed below, or by using the keyword search tool below to find specific information within the annual report.-
 1
1 -
2
-
3
-
4
-
5
-
6
-
7
-
8
-
9
-
10
-
11
-
12
-
13
-
14
-
15
-
16
-
17
-
18
-
19
-
20
-
21
-
22
-
23
-
24
-
25
-
26
-
27
-
28
-
29
-
30
-
31
-
32
-
33
-
34
-
35
-
36
-
37
-
38
-
39
-
40
-
41
-
42
-
43
-
44
-
45
-
46
-
47
-
48
-
49
-
50
-
51
-
52
-
53
-
54
-
55
-
56
-
57
-
58
-
59
-
60
-
61
-
62
-
63
-
64
-
65
-
66
-
67
-
68
-
69
-
70
-
71
-
72
-
73
-
74
-
75
-
76
-
77
-
78
-
79
-
80
-
81
-
82
-
83
-
84
-
85
-
86
-
87
-
88
-
89
-
90
-
91
-
92
-
93
-
94
-
95
-
96
-
97
-
98
-
99
-
100
-
101
-
102
-
103
-
104
-
105
-
106
-
107
-
108
-
109
-
110
-
111
-
112
-
113
-
114
-
115
-
116
-
 117
117 -
 118
118 -
 119
119 -
 120
120 -
 121
121 -
 122
122 -
 123
123 -
 124
124 -
 125
125 -
 126
126 -
 127
127 -
 128
128 -
 129
129 -
 130
130 -
 131
131 -
 132
132 -
 133
133 -
 134
134 -
 135
135 -
 136
136 -
 137
137 -
138
-
139
-
140
-
141
-
142
-
143
-
144
-
145
-
146
-
147
-
148
-
149
-
150
-
151
-
152
-
153
-
154
-
155
-
156
-
157
-
158
-
159
-
160
-
161
-
162
-
163
-
164
 |
 |

125
Introduction
2 – 11
Business review
12 – 51
Governance
52 – 84
Financial statements
85 – 160
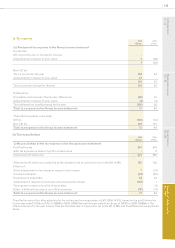
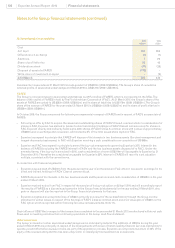
22. Cash and cash equivalents
(a) The analysis of cash and cash equivalents reported in the Group balance sheet is as follows:
2010
US$m
2009
US$m
Cash at bank and in hand 175 127
Short-term investments - 2
175 129
The accounting policies for loans and receivables set out in note 4 have been applied to the above items.
The effective interest rate for cash and cash equivalents at 31 March 2010 is 4.8% (2009: 6.6%). There is no material difference
between the fair value of cash and cash equivalents and the book value stated above.
(b) Cash and cash equivalents are further analysed by external credit rating where the balance with a counterparty is greater
than US$2m:
2010
US$m
2009
US$m
A rated 86 66
B rated 69 54
Counterparty holding of more than US$2m 155 120
Counterparty holding of less than US$2m 20 9
175 129
The above analysis does not include bank deposits of US$44m (2009: US$29m) being amounts held with an A rated counterparty
as collateral against derivative contracts and which are reported within other nancial assets (see note 27(a)).
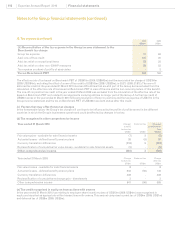
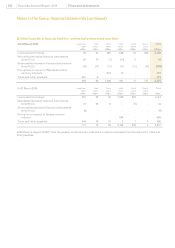
23. Trade and other payables
Current
2010
US$m
Non-current
2010
US$m
Current
2009
US$m
Non-current
2009
US$m
Trade creditors 110 - 104 -
VAT and other taxes payable 31 - 32 -
Social security costs 95 - 78 -
Accruals and deferred income 767 8 751 17
Other creditors 59 6 30 25
1,062 14 995 42
The accounting policies for other nancial liabilities set out in note 4 have been applied to nancial instruments of US$773m
(2009: US$480m) within the above items. VAT and other tax payable of US$31m (2009: US$32m), social security costs of US$95m
(2009: US$78m) and accruals and deferred income of US$177m (2009: US$447m) are not regarded as nancial instruments.
There is no material difference between the fair value of trade and other payables and the book value stated above. All the non-
current trade and other payables are due within ve years from the balance sheet date.
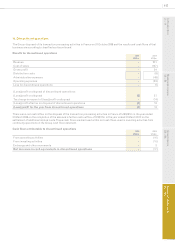
24. Loans and borrowings
(a) The analysis of loans and borrowings reported in the Group balance sheet is as follows:
Current
2010
US$m
Non-current
2010
US$m
Current
2009
US$m
Non-current
2009
US$m
£203m 6.375% Eurobonds 2009 - - 308 -
£334m 5.625% Euronotes 2013 - 552 - 518
€500m 4.75% Guaranteed notes 2020 - 681 - -
Bank loans - 598 - 1,480
Bank overdrafts 12 - 2 -
Finance lease obligations 5 3 4 5
17 1,834 314 2,003