Experian 2010 Annual Report Download - page 75
Download and view the complete annual report
Please find page 75 of the 2010 Experian annual report below. You can navigate through the pages in the report by either clicking on the pages listed below, or by using the keyword search tool below to find specific information within the annual report.
73
Introduction
2 – 11
Business review
12 – 51
Financial statements
85 – 160
Governance
52 – 84
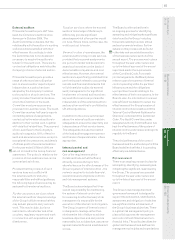
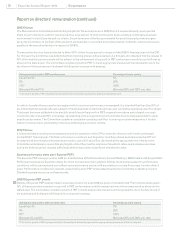
The remaining 25% of the awards made in June 2009 is subject to a total shareholder return ('TSR') performance condition, with
vesting according to the percentage extent to which Experian’s TSR outperforms the TSR of the FTSE 100 Index, as shown in
the table below. The Remuneration Committee determined that TSR was an appropriate performance measure as it represents
value delivered for our shareholders relative to our peers.
In addition, vesting of these awards will be subject to satisfactory ROCE performance, to ensure that earnings growth is
delivered in a sustainable and efcient way.
2010/11 Experian PSP awards
For awards to be made in 2010/11, it is intended that 75% of any award will be subject to a growth in PBT performance condition
and will vest as shown in the table below:
It is intended that the remaining 25% of any award will be subject to the same relative TSR performance condition as applied to
the awards made in June 2009 (see above).
In addition, vesting of any awards made in 2010/11 will be subject to satisfactory ROCE performance.
Experian share option plan
The Experian share option plan was approved by GUS plc shareholders at the EGM held on 29 August 2006. Grants were made
to executive directors under this plan in June 2009. However, following a review of the remuneration package for the executive
directors, the Committee has concluded that no grants will be made under this plan in the coming nancial year. Use of the
Experian share option plan in the future will remain under review by the Committee.
2009/10 Experian share option plan grants
Details of Experian share option plan grants made to executive directors in June 2009 are given in the table titled ‘Share options’.
Vesting of these options is subject to the achievement of the following growth in EPS performance condition:
In addition, vesting of these grants will be subject to satisfactory ROCE performance.
For each of the long-term incentive plans, external consultants will be used to calculate whether, and the extent to which, the
performance conditions have been met.
TSR of Experian over three years Percentage of award vesting
Below that of FTSE 100 Index 0%
Equal to that of FTSE 100 Index 25%
At least 25% above that of FTSE 100 Index 100%
Between equal to and 25% above that of FTSE 100 Index Between 25% and 100% pro rata
Average annual growth in PBT over three years Percentage of award vesting
Less than 5% 0%
5% 25%
11%* 100%
Between 5% and 11% Between 25% and 100% pro rata
* This level of PBT growth is expected by the Committee to be broadly equivalent to upper quartile performance
Average annual growth in EPS over three years Percentage of option grant vesting
Less than 4% 0%
4% 25%
8%* 100%
Between 4% and 8% Between 25% and 100% pro rata
* This level of performance was expected by the Committee to be broadly equivalent to upper quartile performance, at the time of grant
79


