Experian 2010 Annual Report Download - page 9
Download and view the complete annual report
Please find page 9 of the 2010 Experian annual report below. You can navigate through the pages in the report by either clicking on the pages listed below, or by using the keyword search tool below to find specific information within the annual report.-
 1
1 -
 2
2 -
 3
3 -
 4
4 -
 5
5 -
 6
6 -
 7
7 -
 8
8 -
 9
9 -
 10
10 -
 11
11 -
 12
12 -
 13
13 -
 14
14 -
 15
15 -
 16
16 -
 17
17 -
 18
18 -
 19
19 -
 20
20 -
21
-
22
-
23
-
24
-
25
-
26
-
27
-
28
-
29
-
30
-
31
-
32
-
33
-
34
-
35
-
36
-
37
-
38
-
39
-
40
-
41
-
42
-
43
-
44
-
45
-
46
-
47
-
48
-
49
-
50
-
51
-
52
-
53
-
54
-
55
-
56
-
57
-
58
-
59
-
60
-
61
-
62
-
63
-
64
-
65
-
66
-
67
-
68
-
69
-
70
-
71
-
72
-
73
-
74
-
75
-
76
-
77
-
78
-
79
-
80
-
81
-
82
-
83
-
84
-
85
-
86
-
87
-
88
-
89
-
90
-
91
-
92
-
93
-
94
-
95
-
96
-
97
-
98
-
99
-
100
-
101
-
102
-
103
-
104
-
105
-
106
-
107
-
108
-
109
-
110
-
111
-
112
-
113
-
114
-
115
-
116
-
117
-
118
-
119
-
120
-
121
-
122
-
123
-
124
-
125
-
126
-
127
-
128
-
129
-
130
-
131
-
132
-
133
-
134
-
135
-
136
-
137
-
138
-
139
-
140
-
141
-
142
-
143
-
144
-
145
-
146
-
147
-
148
-
149
-
150
-
151
-
152
-
153
-
154
-
155
-
156
-
157
-
158
-
159
-
160
-
161
-
162
-
163
-
164
 |
 |
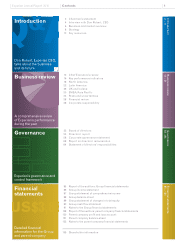
7
Business review
12 – 51
Governance
52 – 84
Financial statements
85 – 160
Introduction
2 – 11
Competitive position
Global revenue US$m
Experian
Equifax
D&B
Acxiom
FICO
Harte-Hanks 8602
9 0 %* 10%
1,2773
86%* 14%
1,6872
78%* 22%
1,8252
81% 19%
3,8591
53%
6314
68%* 32%
North America International
Source: Latest full-year revenue, Company nancials
1 Year ended 31 March 2010
2 Year ended 31 December 2009
3 Year ended 31 March 2009
4 Year ended 30 September 2009
* US only
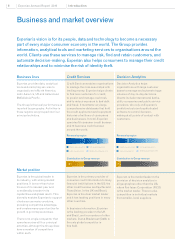
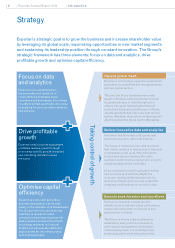
During the year, Experian expanded
its global reach and now has a
Marketing Services presence in
major economies around the world,
including the UK, US, Germany,
France, China and Japan. This
enables the Group to provide
marketing solutions to global
companies.
In the US, large marketing
competitors for traditional direct
marketing services include Acxiom
and Harte-Hanks. Competition
elsewhere tends to be fragmented
and specialised.
Experian’s direct-to-consumer, credit
information business is the clear
market leader in both the US and UK.
In the US, competition is provided by
Equifax, TransUnion, FICO and other
smaller specialists, but Experian
is more than twice the size of any
of these competitors. In the UK,
competition is provided by Equifax
and smaller niche suppliers.
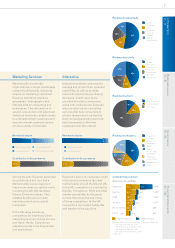
Marketing Services
Marketing Services helps
organisations to target and engage
customers effectively, improving
returns on marketing investment.
Experian maintains extensive
geographic, demographic and
lifestyle data on consumers and
businesses. This information is
used in conjunction with advanced
analytical systems to enable clients
to understand their customers and
execute relevant communications
across a variety of channels.
Interactive
Interactive enables consumers to
manage and protect their personal
credit les, as well as to make
more informed online purchasing
decisions. Credit reports are
provided directly to consumers,
along with credit scores. Experian
also provides online monitoring
services that help consumers to
protect themselves from identity
theft. Its lead generation services
help businesses to nd new
customers over the internet.
Revenue by region
UK and Ireland 33%North America 45%
Latin America 2% EMEA/Asia Pacic 20%
Contribution to Group revenue
19%
Revenue by region
North America 89%
UK and Ireland 11%
Contribution to Group revenue
27%
Revenue by industry Financial
services
Direct-to-
consumer
Retail
Public
sector and
education
Telecoms
and utilities
Automotive
Other
36%
19%
14%
16%
5%
5%
5%
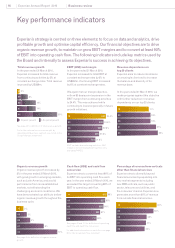
Revenue by activity
Credit
Services
Decision
Analytics
Marketing
Services
Interactive
43%
11%
19%
27%
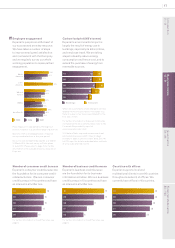
Revenue by geography
North
America
Latin
America
UK and
Ireland
EMEA/
Asia Pacic
53%
15%
20%
12%
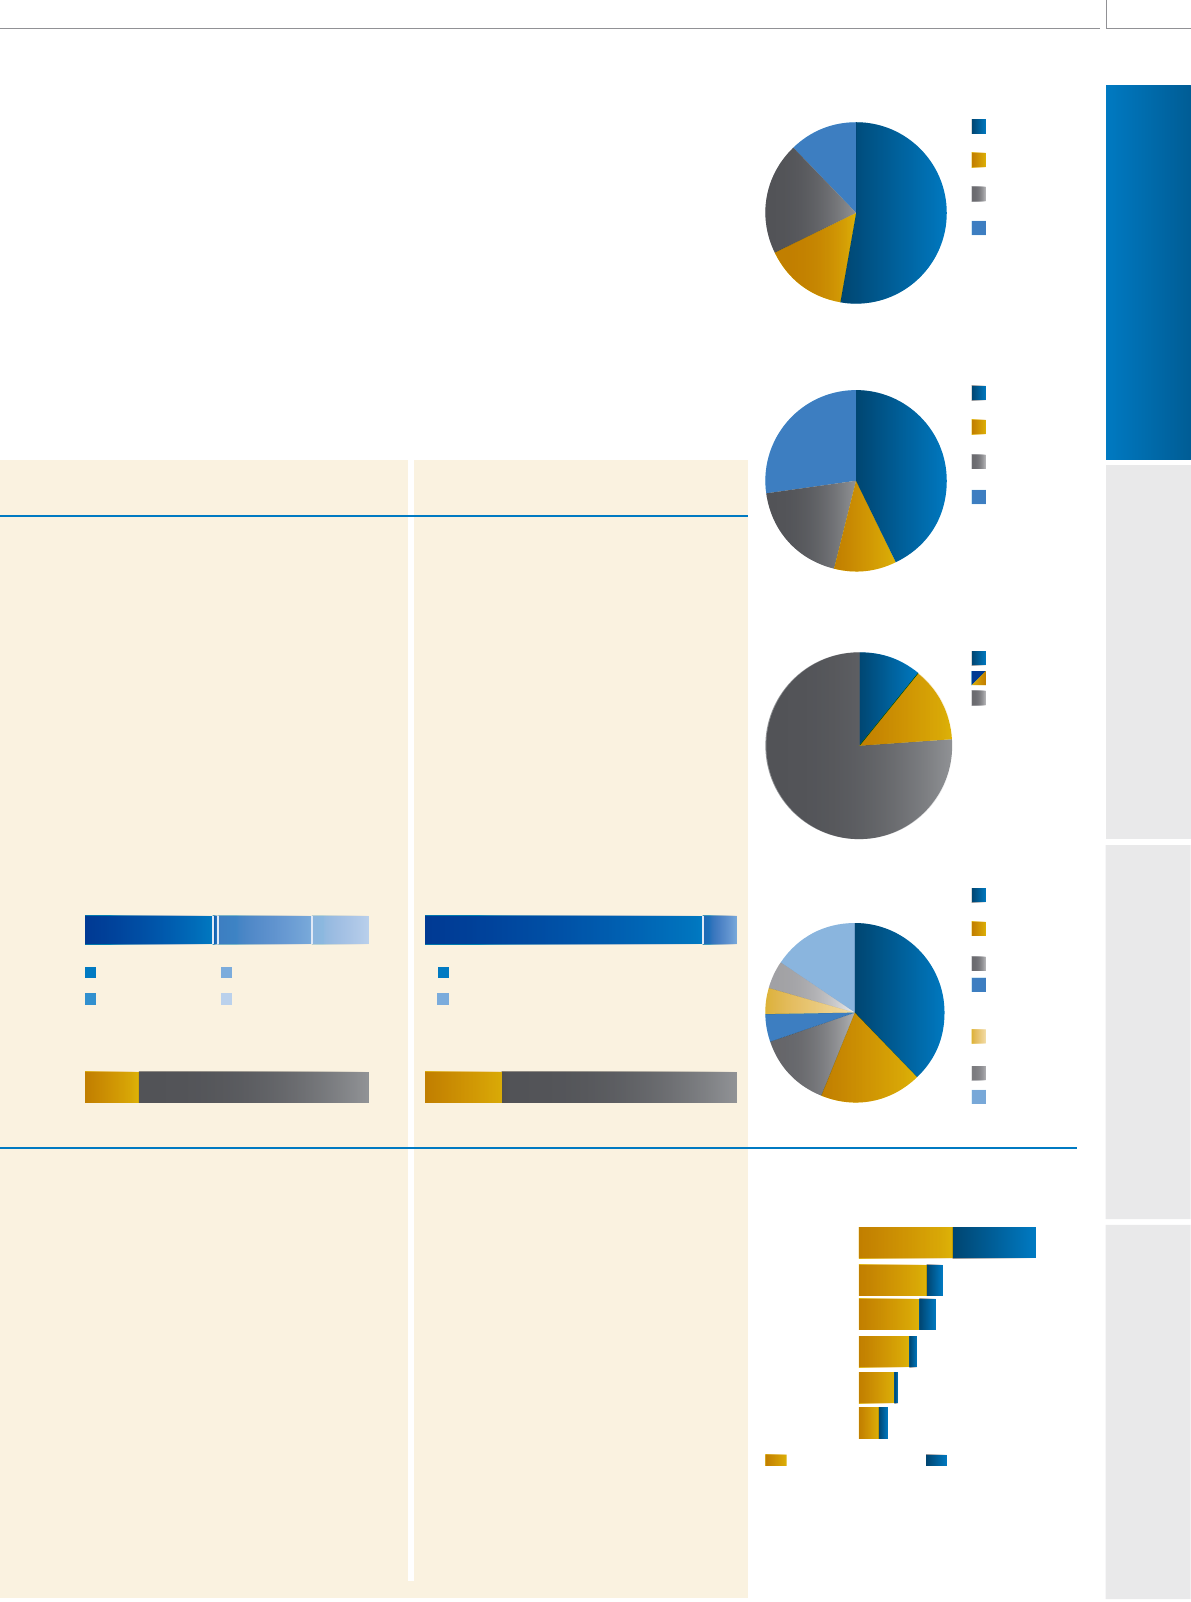
Top 10 clients
Top 50 clients
All other
Revenue by client
11%
13%
76%
47%