Experian 2010 Annual Report Download - page 28
Download and view the complete annual report
Please find page 28 of the 2010 Experian annual report below. You can navigate through the pages in the report by either clicking on the pages listed below, or by using the keyword search tool below to find specific information within the annual report.-
 1
1 -
2
-
3
-
4
-
5
-
6
-
7
-
8
-
9
-
10
-
11
-
12
-
13
-
14
-
15
-
16
-
17
-
 18
18 -
 19
19 -
 20
20 -
 21
21 -
 22
22 -
 23
23 -
 24
24 -
 25
25 -
 26
26 -
 27
27 -
 28
28 -
 29
29 -
 30
30 -
 31
31 -
 32
32 -
 33
33 -
 34
34 -
 35
35 -
 36
36 -
 37
37 -
 38
38 -
39
-
40
-
41
-
42
-
43
-
44
-
45
-
46
-
47
-
48
-
49
-
50
-
51
-
52
-
53
-
54
-
55
-
56
-
57
-
58
-
59
-
60
-
61
-
62
-
63
-
64
-
65
-
66
-
67
-
68
-
69
-
70
-
71
-
72
-
73
-
74
-
75
-
76
-
77
-
78
-
79
-
80
-
81
-
82
-
83
-
84
-
85
-
86
-
87
-
88
-
89
-
90
-
91
-
92
-
93
-
94
-
95
-
96
-
97
-
98
-
99
-
100
-
101
-
102
-
103
-
104
-
105
-
106
-
107
-
108
-
109
-
110
-
111
-
112
-
113
-
114
-
115
-
116
-
117
-
118
-
119
-
120
-
121
-
122
-
123
-
124
-
125
-
126
-
127
-
128
-
129
-
130
-
131
-
132
-
133
-
134
-
135
-
136
-
137
-
138
-
139
-
140
-
141
-
142
-
143
-
144
-
145
-
146
-
147
-
148
-
149
-
150
-
151
-
152
-
153
-
154
-
155
-
156
-
157
-
158
-
159
-
160
-
161
-
162
-
163
-
164
 |
 |
Experian Annual Report 2010 Business review26
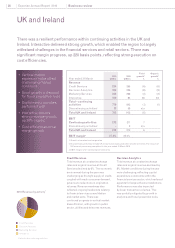
UK and Ireland
There was a resilient performance within continuing activities in the UK and
Ireland. Interactive delivered strong growth, which enabled the region to largely
withstand challenges in the nancial services and retail sectors. There was
signicant margin progress, up 220 basis points, reecting strong execution on
cost efciencies.
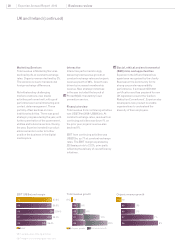
Decision Analytics
Total revenue at constant exchange
rates and organic revenue declined by
8%. Market conditions during the year
were challenging, reecting capital
expenditure constraints within the
nancial services sector, which reduced
appetite for large software installations.
Performance was also impacted
by lower transaction volumes. This
was partially mitigated by growth in
analytics and fraud prevention tools.
Credit Services
Total revenue at constant exchange
rates and organic revenue at Credit
Services declined by 6%. The economic
environment during the year was
challenging as the tight supply of credit,
coupled with weak consumer demand,
gave rise to reductions in origination
volumes. Revenue weakness also
reected ongoing headwinds relating
to nancial services consolidation
and market exits. There was
continued progress in vertical market
diversication, with growth in public
sector, utilities and telecoms revenues.
Vertical market •
expansion helps offset
challenging market
conditions
Good growth in demand •
for fraud prevention tools
Digital media activities •
performed well
Interactive delivers •
strong revenue growth;
up 38% organic
Cost efciencies drive •
margin growth
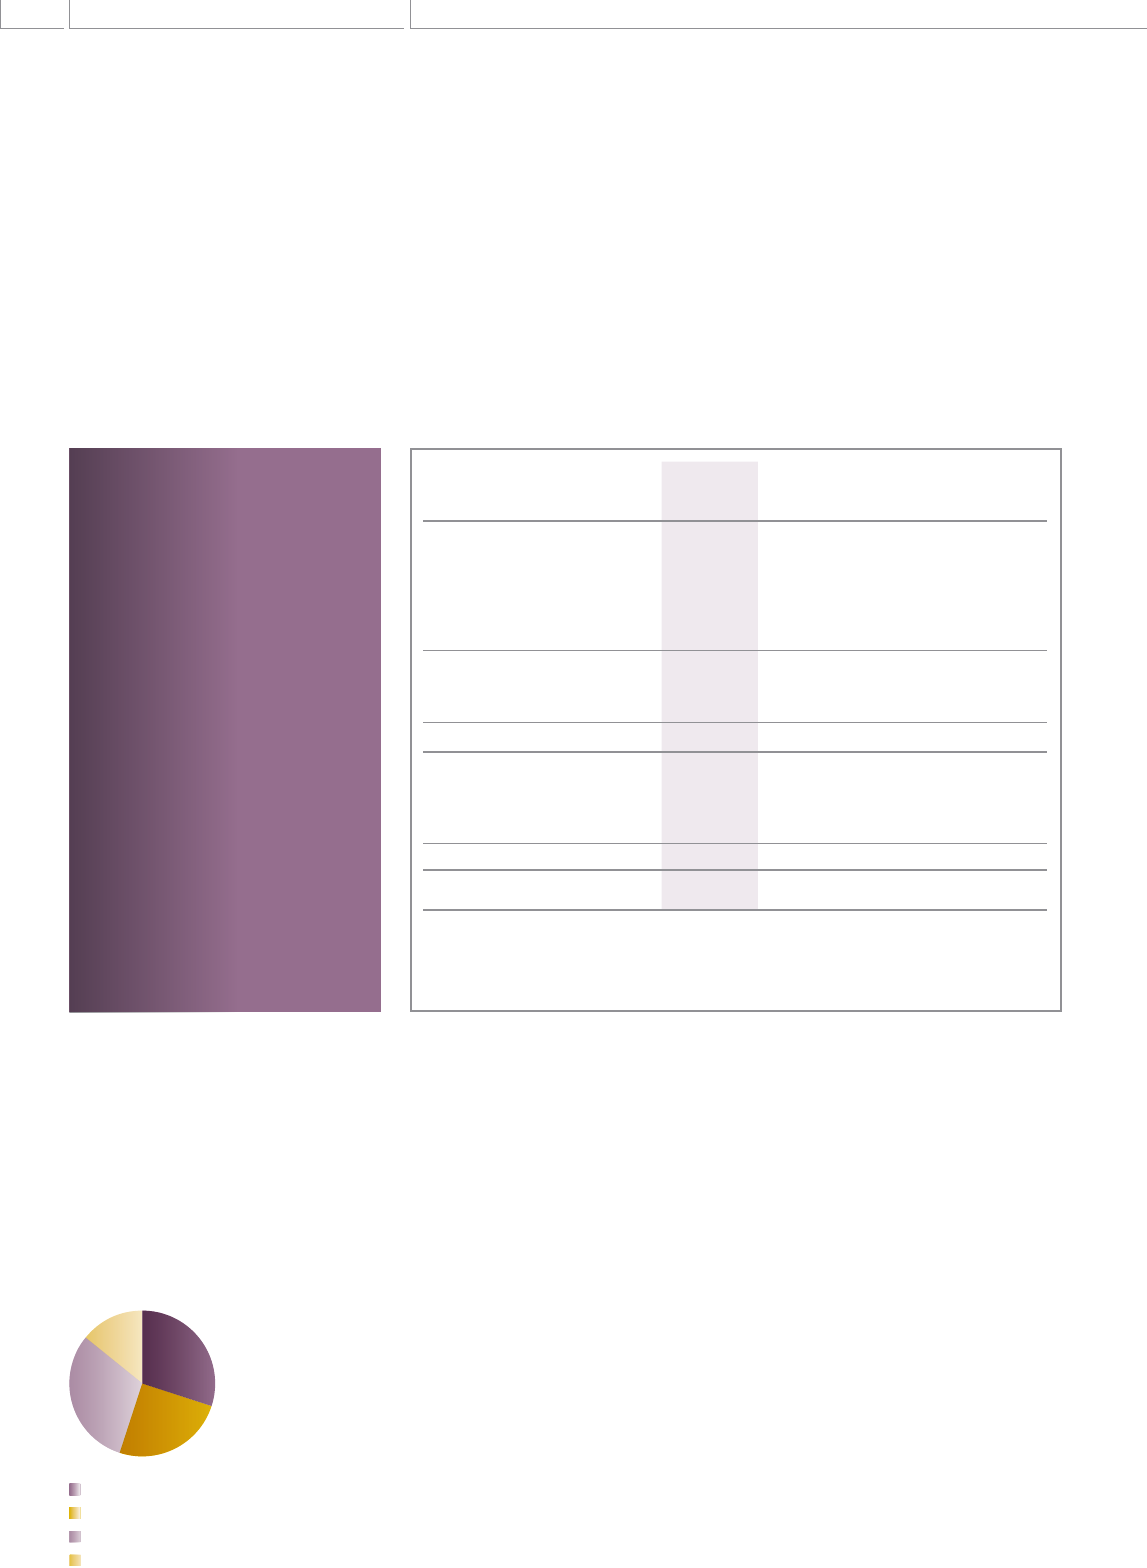
2010 Revenue by activity1
Decision Analytics
Credit Services
Marketing Services
Interactive
1 Excludes discontinuing activities
Year ended 31 March
2010
US$m
2009
US$m
Total
growth1
%
Organic
growth1
%
Revenue
Credit Services 234 265 (6) (6)
Decision Analytics 193 226 (8) (8)
Marketing Services 243 268 (4) (2)
Interactive 109 84 38 38
Total – continuing
activities 779 843 (1) (1)
Discontinuing activities213 59 n/a
Total UK and Ireland 792 902 (6)
EBIT
Continuing activities 212 211 7
Discontinuing activities2-2n/a
Total UK and Ireland 212 213 6
EBIT margin327.2% 25.0%
1. Growth at constant exchange rates
2. Discontinuing activities include UK account processing and other smaller activities. The closure of
UK account processing completed in the year ended 31 March 2010
3. EBIT margin is for continuing activities only