Experian 2010 Annual Report Download - page 126
Download and view the complete annual report
Please find page 126 of the 2010 Experian annual report below. You can navigate through the pages in the report by either clicking on the pages listed below, or by using the keyword search tool below to find specific information within the annual report.-
 1
1 -
2
-
3
-
4
-
5
-
6
-
7
-
8
-
9
-
10
-
11
-
12
-
13
-
14
-
15
-
16
-
17
-
18
-
19
-
20
-
21
-
22
-
23
-
24
-
25
-
26
-
27
-
28
-
29
-
30
-
31
-
32
-
33
-
34
-
35
-
36
-
37
-
38
-
39
-
40
-
41
-
42
-
43
-
44
-
45
-
46
-
47
-
48
-
49
-
50
-
51
-
52
-
53
-
54
-
55
-
56
-
57
-
58
-
59
-
60
-
61
-
62
-
63
-
64
-
65
-
66
-
67
-
68
-
69
-
70
-
71
-
72
-
73
-
74
-
75
-
76
-
77
-
78
-
79
-
80
-
81
-
82
-
83
-
84
-
85
-
86
-
87
-
88
-
89
-
90
-
91
-
92
-
93
-
94
-
95
-
96
-
97
-
98
-
99
-
100
-
101
-
102
-
103
-
104
-
105
-
106
-
107
-
108
-
109
-
110
-
111
-
112
-
113
-
114
-
115
-
 116
116 -
 117
117 -
 118
118 -
 119
119 -
 120
120 -
 121
121 -
 122
122 -
 123
123 -
 124
124 -
 125
125 -
 126
126 -
 127
127 -
 128
128 -
 129
129 -
 130
130 -
 131
131 -
 132
132 -
 133
133 -
 134
134 -
 135
135 -
 136
136 -
137
-
138
-
139
-
140
-
141
-
142
-
143
-
144
-
145
-
146
-
147
-
148
-
149
-
150
-
151
-
152
-
153
-
154
-
155
-
156
-
157
-
158
-
159
-
160
-
161
-
162
-
163
-
164
 |
 |

Experian Annual Report 2010 Financial statements124
Notes to the Group nancial statements (continued)
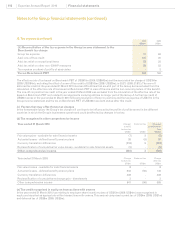
21. Trade and other receivables (continued)
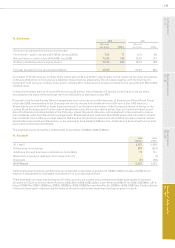
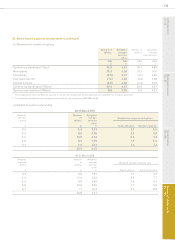
(d) Trade receivables of US$182m (2009: US$134m) were past due but not considered impaired and these are further analysed as
follows:
Current
2010
US$m
Current
2009
US$m
Up to three months 159 108
Three to six months 15 20
Over six months 8 6
182 134
(e) Trade receivables of US$54m (2009: US$29m) were considered partially impaired and provided for and these are further
analysed as follows:
Current
2010
US$m
Current
2009
US$m
Up to three months 12 9
Three to six months 15 9
Over six months 27 11
54 29
Impairment provision (38) (25)
16 4
The other classes within trade and other receivables at the balance sheet dates do not include any impaired assets.
(f) Movements in the impairment provision are as follows:
2010
US$m
2009
US$m
At 1 April 25 24
Differences on exchange 2 (3)
Provision for receivables impairment 29 13
Provision utilised in respect of debts written off (12) (6)
Unused amounts reversed (6) (3)
At 31 March 38 25
The impairment provision has been determined by reference to the age of the receivable and an assessment of the portion of the
receivable expected to be recovered. Amounts charged and credited to the Group income statement in respect of this provision
are included in administrative expenses. Other provisions in respect of trade receivables mainly comprise credit note provisions.