Wells Fargo 2005 Annual Report Download - page 99
Download and view the complete annual report
Please find page 99 of the 2005 Wells Fargo annual report below. You can navigate through the pages in the report by either clicking on the pages listed below, or by using the keyword search tool below to find specific information within the annual report.-
 1
1 -
2
-
3
-
4
-
5
-
6
-
7
-
8
-
9
-
10
-
11
-
12
-
13
-
14
-
15
-
16
-
17
-
18
-
19
-
20
-
21
-
22
-
23
-
24
-
25
-
26
-
27
-
28
-
29
-
30
-
31
-
32
-
33
-
34
-
35
-
36
-
37
-
38
-
39
-
40
-
41
-
42
-
43
-
44
-
45
-
46
-
47
-
48
-
49
-
50
-
51
-
52
-
53
-
54
-
55
-
56
-
57
-
58
-
59
-
60
-
61
-
62
-
63
-
64
-
65
-
66
-
67
-
68
-
69
-
70
-
71
-
72
-
73
-
74
-
75
-
76
-
77
-
78
-
79
-
80
-
81
-
82
-
83
-
84
-
85
-
86
-
87
-
88
-
 89
89 -
 90
90 -
 91
91 -
 92
92 -
 93
93 -
 94
94 -
 95
95 -
 96
96 -
 97
97 -
 98
98 -
 99
99 -
 100
100 -
 101
101 -
 102
102 -
 103
103 -
 104
104 -
 105
105 -
 106
106 -
 107
107 -
 108
108 -
 109
109 -
110
-
111
-
112
-
113
-
114
-
115
-
116
-
117
-
118
-
119
-
120
 |
 |

97
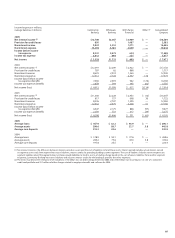
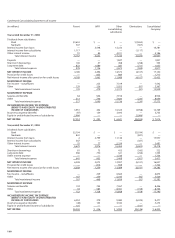
(in millions) December 31, Year ended December 31,
Total loans(1) Delinquent loans(2) Net charge-offs (recoveries)
2005 2004 2005 2004 2005 2004
Commercial and commercial real estate:
Commercial $ 61,552 $ 54,517 $ 304 $ 371 $ 273 $ 274
Other real estate mortgage 45,042 48,402 344 370 11 32
Real estate construction 13,406 9,025 40 63 (7) (1)
Lease financing 5,400 5,169 45 68 14 36
Total commercial and commercial real estate 125,400 117,113 733 872 291 341
Consumer:
Real estate 1-4 family first mortgage 136,261 132,703 709 724 90 47
Real estate 1-4 family junior lien mortgage 59,143 52,190 194 132 105 83
Credit card 12,009 10,260 159 150 467 401
Other revolving credit and installment 48,287 43,744 470 476 1,115 699
Total consumer 255,700 238,897 1,532 1,482 1,777 1,230
Foreign 5,930 4,527 71 99 239 122
Total loans owned and securitized 387,030 360,537 $2,336 $2,453 $2,307 $1,693
Less:
Securitized loans 35,047 34,489
Mortgages held for sale 40,534 29,723
Loans held for sale 612 8,739
Total loans held $310,837 $287,586
(1) Represents loans on the balance sheet or that have been securitized, but excludes securitized loans that we continue to service but as to which we have no other
continuing involvement.
(2) Includes nonaccrual loans and loans 90 days or more past due and still accruing.
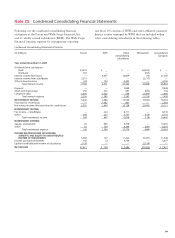
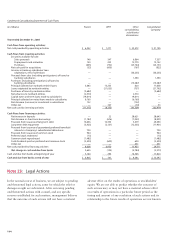
This table presents information about the principal balances of owned and securitized loans.
We are a variable interest holder in certain special-purpose
entities that are consolidated because we absorb a majority
of each entity’s expected losses, receive a majority of each
entity’s expected returns or both. We do not hold a majority
voting interest in these entities. Our consolidated variable
interest entities (VIEs), substantially all of which were
formed to invest in securities and to securitize real estate
investment trust securities, had approximately $2.5 billion
and $6 billion in total assets at December 31, 2005 and
2004, respectively. The primary activities of these entities
consist of acquiring and disposing of, and investing and
reinvesting in securities, and issuing beneficial interests secured
by those securities to investors. The creditors of most of these
consolidated entities have no recourse against us.
We also hold variable interests greater than 20% but
less than 50% in certain special-purpose entities formed
to provide affordable housing and to securitize corporate
debt that had approximately $3 billion in total assets at
December 31, 2005 and 2004. We are not required to
consolidate these entities. Our maximum exposure to loss
as a result of our involvement with these unconsolidated
variable interest entities was approximately $870 million
and $950 million at December 31, 2005 and 2004, respectively,
predominantly representing investments in entities formed to
invest in affordable housing. We, however, expect to recover
our investment over time primarily through realization of
federal low-income housing tax credits.
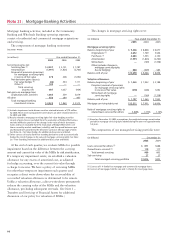
($ in millions) Retained
interest – AAA
mortgage-
backed
securities
Fair value of retained interests $3,358
Expected weighted-average life (in years) 2.2
Prepayment speed assumption (annual CPR) 28.1%
Decrease in fair value from 10% adverse change $ —
Decrease in fair value from 25% adverse change —
Discount spread to LIBOR curve assumption .22%
Decrease in fair value from 10 basis point adverse change $ 7
Decrease in fair value from 20 basis point adverse change 14
The sensitivities in the previous tables are hypothetical
and should be relied on with caution. Changes in fair value
based on a 10% variation in assumptions generally cannot
be extrapolated because the relationship of the change in
the assumption to the change in fair value may not be linear.
Also, in the previous tables, the effect of a variation in a
particular assumption on the fair value of the retained
interest is calculated independently without changing any
other assumption. In reality, changes in one factor may result
in changes in another (for example, changes in prepayment
speed estimates could result in changes in the discount rates),
which might magnify or counteract the sensitivities.