Wells Fargo 2005 Annual Report Download - page 43
Download and view the complete annual report
Please find page 43 of the 2005 Wells Fargo annual report below. You can navigate through the pages in the report by either clicking on the pages listed below, or by using the keyword search tool below to find specific information within the annual report.-
 1
1 -
2
-
3
-
4
-
5
-
6
-
7
-
8
-
9
-
10
-
11
-
12
-
13
-
14
-
15
-
16
-
17
-
18
-
19
-
20
-
21
-
22
-
23
-
24
-
25
-
26
-
27
-
28
-
29
-
30
-
31
-
32
-
 33
33 -
 34
34 -
 35
35 -
 36
36 -
 37
37 -
 38
38 -
 39
39 -
 40
40 -
 41
41 -
 42
42 -
 43
43 -
 44
44 -
 45
45 -
 46
46 -
 47
47 -
 48
48 -
 49
49 -
 50
50 -
 51
51 -
 52
52 -
 53
53 -
54
-
55
-
56
-
57
-
58
-
59
-
60
-
61
-
62
-
63
-
64
-
65
-
66
-
67
-
68
-
69
-
70
-
71
-
72
-
73
-
74
-
75
-
76
-
77
-
78
-
79
-
80
-
81
-
82
-
83
-
84
-
85
-
86
-
87
-
88
-
89
-
90
-
91
-
92
-
93
-
94
-
95
-
96
-
97
-
98
-
99
-
100
-
101
-
102
-
103
-
104
-
105
-
106
-
107
-
108
-
109
-
110
-
111
-
112
-
113
-
114
-
115
-
116
-
117
-
118
-
119
-
120
 |
 |

41
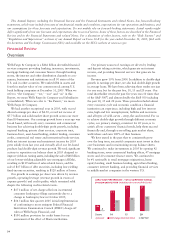
Earnings Performance
Net Interest Income
Net interest income is the interest earned on debt securities,
loans (including yield-related loan fees) and other interest-
earning assets minus the interest paid for deposits and long-
term and short-term debt. The net interest margin is the
average yield on earning assets minus the average interest
rate paid for deposits and our other sources of funding. Net
interest income and the net interest margin are presented on
a taxable-equivalent basis to consistently reflect income from
taxable and tax-exempt loans and securities based on a 35%
marginal tax rate.
Net interest income on a taxable-equivalent basis was
$18.6 billion in 2005, compared with $17.3 billion in 2004,
an increase of 8%, reflecting solid loan growth (other than
ARMs) and a relatively flat net interest margin.
Our net interest margin was 4.86% for 2005 and 4.89%
for 2004. During a year in which the Federal Reserve raised
rates eight times and the yield curve flattened, our net interest
margin remained essentially flat compared with a year ago.
Given the prospect of higher short-term interest rates and
a flatter yield curve, beginning in second quarter 2004, as
part of our asset/liability management strategy, we sold the
lowest-yielding ARMs on our balance sheet, replacing some
of these loans with higher-yielding ARMs. Over the last
seven quarters, we sold $65 billion in ARMs at an average
yield of 4.28%. As a result, the average yield on our 1-4
family first mortgage portfolio—which includes ARMs —
increased from 5.19% on an average balance of $89.4 billion
in second quarter 2004 to 6.75% on an average balance
of $76.2 billion in fourth quarter 2005. At year-end 2005,
yields on new ARMs being held for investment within real
estate 1-4 family mortgage loans were more than 1% higher
than the average yield on the ARMs sold since second quarter
2004. Our net interest margin has performed better than our
peers’ due to our balance sheet repositioning actions and our
ability to grow transaction and savings deposits while main-
taining our deposit pricing discipline.
Average earning assets increased $29.2 billion to
$383.5 billion in 2005 from $354.3 billion in 2004. Loans
averaged $296.1 billion in 2005, compared with $269.6 billion
in 2004. Average mortgages held for sale were $39.0 billion
in 2005 and $32.3 billion in 2004. Debt securities available
for sale averaged $33.1 billion in both 2005 and 2004.
Average core deposits are an important contributor to
growth in net interest income and the net interest margin.
This low-cost source of funding rose 9% from 2004. Average
core deposits were $242.8 billion and $223.4 billion and
funded 54.5% and 54.4% of average total assets in 2005
and 2004, respectively. Total average retail core deposits,
which exclude Wholesale Banking core deposits and retail
mortgage escrow deposits, for 2005 grew $18.2 billion,
or 10%, from a year ago. Average mortgage escrow
deposits were $16.7 billion in 2005 and $14.1 billion in
2004. Savings certificates of deposits increased on average
from $18.9 billion in 2004 to $22.6 billion in 2005 and
noninterest-bearing checking accounts and other core
deposit categories increased on average from $204.5 billion
in 2004 to $220.1 billion in 2005. Total average interest-
bearing deposits increased to $194.6 billion in 2005 from
$182.6 billion a year ago. Total average noninterest-bearing
deposits increased to $87.2 billion in 2005 from $79.3 billion
a year ago.
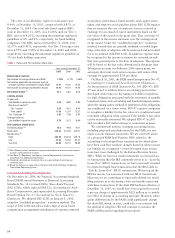
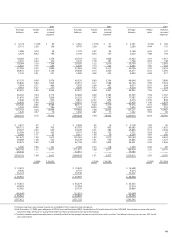
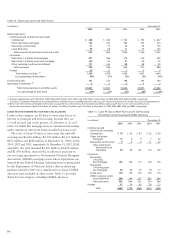
Table 3 presents the individual components of net interest
income and the net interest margin.