Wells Fargo 2005 Annual Report Download - page 73
Download and view the complete annual report
Please find page 73 of the 2005 Wells Fargo annual report below. You can navigate through the pages in the report by either clicking on the pages listed below, or by using the keyword search tool below to find specific information within the annual report.-
 1
1 -
2
-
3
-
4
-
5
-
6
-
7
-
8
-
9
-
10
-
11
-
12
-
13
-
14
-
15
-
16
-
17
-
18
-
19
-
20
-
21
-
22
-
23
-
24
-
25
-
26
-
27
-
28
-
29
-
30
-
31
-
32
-
33
-
34
-
35
-
36
-
37
-
38
-
39
-
40
-
41
-
42
-
43
-
44
-
45
-
46
-
47
-
48
-
49
-
50
-
51
-
52
-
53
-
54
-
55
-
56
-
57
-
58
-
59
-
60
-
61
-
62
-
 63
63 -
 64
64 -
 65
65 -
 66
66 -
 67
67 -
 68
68 -
 69
69 -
 70
70 -
 71
71 -
 72
72 -
 73
73 -
 74
74 -
 75
75 -
 76
76 -
 77
77 -
 78
78 -
 79
79 -
 80
80 -
 81
81 -
 82
82 -
 83
83 -
84
-
85
-
86
-
87
-
88
-
89
-
90
-
91
-
92
-
93
-
94
-
95
-
96
-
97
-
98
-
99
-
100
-
101
-
102
-
103
-
104
-
105
-
106
-
107
-
108
-
109
-
110
-
111
-
112
-
113
-
114
-
115
-
116
-
117
-
118
-
119
-
120
 |
 |

71
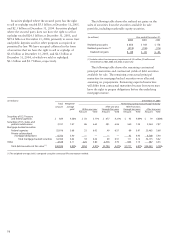
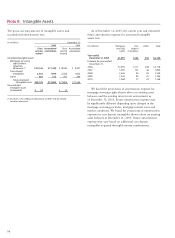
The following table shows the unrealized gross losses
and fair value of securities in the securities available for
sale portfolio at December 31, 2005 and 2004, by length
of time that individual securities in each category had been
in a continuous loss position.
The decline in fair value for the debt securities that had
been in a continuous loss position for 12 months or more at
December 31, 2005, was primarily due to changes in market
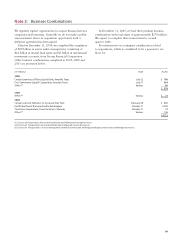
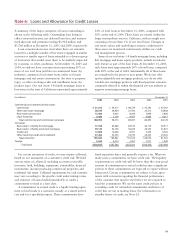
The following table provides the cost and fair value for the
major categories of securities available for sale carried at fair
Note 5: Securities Available for Sale
value. There were no securities classified as held to maturity
as of the periods presented.
interest rates and not due to the credit quality of the securities.
We believe that the principal and interest on these securities
are fully collectible and we have the intent and ability to
retain our investment for a period of time to allow for any
anticipated recovery in market value. We have reviewed these
securities in accordance with our policy and do not consider
them to be other-than-temporarily impaired.
(in millions) December 31,
2005 2004
Cost Unrealized Unrealized Fair Cost Unrealized Unrealized Fair
gross gross value gross gross value
gains losses gains losses
Securities of U.S. Treasury and federal agencies $ 845 $ 4 $ (10) $ 839 $ 1,128 $ 16 $ (4) $ 1,140
Securities of U.S. states and political subdivisions 3,048 149 (6) 3,191 3,429 196 (4) 3,621
Mortgage-backed securities:
Federal agencies 25,304 336 (24) 25,616 20,198 750 (4) 20,944
Private collateralized
mortgage obligations (1) 6,628 128 (6) 6,750 4,082 121 (4) 4,199
Total mortgage-backed securities 31,932 464 (30) 32,366 24,280 871 (8) 25,143
Other 4,518 75 (55) 4,538 2,974 157 (14) 3,117
Total debt securities 40,343 692 (101) 40,934 31,811 1,240 (30) 33,021
Marketable equity securities 558 349 (7) 900 507 198 (9) 696
Total (2) $40,901 $1,041 $(108) $41,834 $32,318 $1,438 $(39) $33,717
(1) Substantially all of the private collateralized mortgage obligations are AAA-rated bonds collateralized by 1-4 family residential first mortgages.
(2) At December 31, 2005, we held no securities of any single issuer (excluding the U.S.Treasury and federal agencies) with a book value that exceeded 10% of stockholders’equity.
(in millions) Less than 12 months 12 months or more Total
Unrealized Fair Unrealized Fair Unrealized Fair
gross value gross value gross value
losses losses losses
December 31, 2005
Securities of U.S. Treasury and federal agencies $ (6) $ 341 $ (4) $142 $ (10) $ 483
Securities of U.S. states and political subdivisions (3) 204 (3) 57 (6) 261
Mortgage-backed securities:
Federal agencies (22) 2,213 (2) 89 (24) 2,302
Private collateralized
mortgage obligations (6) 1,494 — — (6) 1,494
Total mortgage-backed securities (28) 3,707 (2) 89 (30) 3,796
Other (38) 890 (17) 338 (55) 1,228
Total debt securities (75) 5,142 (26) 626 (101) 5,768
Marketable equity securities (7) 185 — — (7) 185
Total $(82) $5,327 $(26) $626 $(108) $5,953
December 31, 2004
Securities of U.S. Treasury and federal agencies $ (4) $ 304 $ — $ — $ (4) $ 304
Securities of U.S. states and political subdivisions (1) 65 (3) 62 (4) 127
Mortgage-backed securities:
Federal agencies (4) 450 — — (4) 450
Private collateralized
mortgage obligations (4) 981 — — (4) 981
Total mortgage-backed securities (8) 1,431 — — (8) 1,431
Other (11) 584 (3) 56 (14) 640
Total debt securities (24) 2,384 (6) 118 (30) 2,502
Marketable equity securities (9) 44 — — (9) 44
Total $(33) $ 2,428 $ (6) $118 $ (39) $ 2,546