Wells Fargo 2005 Annual Report Download - page 91
Download and view the complete annual report
Please find page 91 of the 2005 Wells Fargo annual report below. You can navigate through the pages in the report by either clicking on the pages listed below, or by using the keyword search tool below to find specific information within the annual report.-
 1
1 -
2
-
3
-
4
-
5
-
6
-
7
-
8
-
9
-
10
-
11
-
12
-
13
-
14
-
15
-
16
-
17
-
18
-
19
-
20
-
21
-
22
-
23
-
24
-
25
-
26
-
27
-
28
-
29
-
30
-
31
-
32
-
33
-
34
-
35
-
36
-
37
-
38
-
39
-
40
-
41
-
42
-
43
-
44
-
45
-
46
-
47
-
48
-
49
-
50
-
51
-
52
-
53
-
54
-
55
-
56
-
57
-
58
-
59
-
60
-
61
-
62
-
63
-
64
-
65
-
66
-
67
-
68
-
69
-
70
-
71
-
72
-
73
-
74
-
75
-
76
-
77
-
78
-
79
-
80
-
 81
81 -
 82
82 -
 83
83 -
 84
84 -
 85
85 -
 86
86 -
 87
87 -
 88
88 -
 89
89 -
 90
90 -
 91
91 -
 92
92 -
 93
93 -
 94
94 -
 95
95 -
 96
96 -
 97
97 -
 98
98 -
 99
99 -
 100
100 -
 101
101 -
102
-
103
-
104
-
105
-
106
-
107
-
108
-
109
-
110
-
111
-
112
-
113
-
114
-
115
-
116
-
117
-
118
-
119
-
120
 |
 |

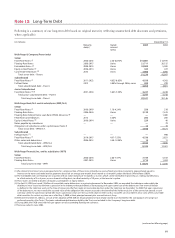
89
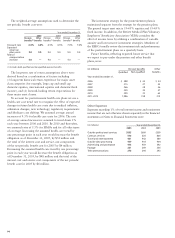
The table to the right provides information for pension
plans with benefit obligations in excess of plan assets,
substantially due to our nonqualified pension plans.
(in millions) December 31,
2005 2004
Projected benefit obligation $359 $294
Accumulated benefit obligation 297 247
Fair value of plan assets 60 55
Percentage of plan assets at December 31,
2005 2004
Pension Other Pension Other
plan benefit plan benefit
assets plan assets assets plan assets
Equity securities 69% 58% 63% 51%
Debt securities 27 40 33 46
Real estate 31 31
Other 1 1 1 2
Total 100% 100% 100% 100%
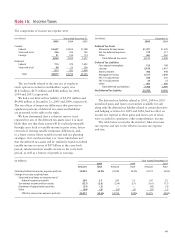
This table reconciles the funded status of the plans to the amounts included in the Consolidated Balance Sheet.
(in millions) December 31,
2005 2004
Pension benefits Pension benefits
Non- Other Non- Other
Qualified qualified benefits Qualified qualified benefits
Funded status (1) $ 899 $(277) $(339) $ 680 $(228) $(422)
Employer contributions in December —24 —1 5
Unrecognized net actuarial loss 615 42 131 647 25 158
Unrecognized net transition asset —— 3 ——3
Unrecognized prior service cost (25)(11)(51) (67)(20) (8)
Accrued benefit income (cost) $1,489 $(244) $(252) $1,260 $(222) $(264)
Amounts recognized in the balance sheet
consist of:
Prepaid benefit cost $1,489 $ — $ — $1,260 $— $—
Accrued benefit liability — (245) (252) — (223) (264)
Accumulated other
comprehensive income — 1 — — 1 —
Accrued benefit income (cost) $ 1,489 $(244) $(252) $1,260 $(222) $(264)
(1) Fair value of plan assets at year end less projected benefit obligation at year end.
The weighted-average allocation of plan assets was:
The net periodic benefit cost was:
(in millions) Year ended December 31,
2005 2004 2003
Pension benefits Pension benefits Pension benefits
Non- Other Non- Other Non- Other
Qualified qualified benefits Qualified qualified benefits Qualified qualified benefits
Service cost $ 208 $21 $ 21 $ 170 $23 $ 17 $ 164 $22 $ 15
Interest cost 220 14 41 215 13 43 209 14 42
Expected return
on plan assets (393) — (25) (327) — (23) (275) — (18)
Recognized
net actuarial
loss (gain) (1) 68 3 6 51 1 2 85 7 (3)
Amortization of
prior service cost (4) (2) (1) (1) (1) (1) 16 — (1)
Amortization of
unrecognized
transition asset ——— ——— — — 1
Settlement — — — (2) 2 — — — —
Net periodic
benefit cost $ 99 $36 $ 42 $ 106 $38 $ 38 $ 199 $43 $ 36
(1) Net actuarial loss (gain) is generally amortized over five years.