Wells Fargo 2005 Annual Report Download - page 116
Download and view the complete annual report
Please find page 116 of the 2005 Wells Fargo annual report below. You can navigate through the pages in the report by either clicking on the pages listed below, or by using the keyword search tool below to find specific information within the annual report.-
 1
1 -
2
-
3
-
4
-
5
-
6
-
7
-
8
-
9
-
10
-
11
-
12
-
13
-
14
-
15
-
16
-
17
-
18
-
19
-
20
-
21
-
22
-
23
-
24
-
25
-
26
-
27
-
28
-
29
-
30
-
31
-
32
-
33
-
34
-
35
-
36
-
37
-
38
-
39
-
40
-
41
-
42
-
43
-
44
-
45
-
46
-
47
-
48
-
49
-
50
-
51
-
52
-
53
-
54
-
55
-
56
-
57
-
58
-
59
-
60
-
61
-
62
-
63
-
64
-
65
-
66
-
67
-
68
-
69
-
70
-
71
-
72
-
73
-
74
-
75
-
76
-
77
-
78
-
79
-
80
-
81
-
82
-
83
-
84
-
85
-
86
-
87
-
88
-
89
-
90
-
91
-
92
-
93
-
94
-
95
-
96
-
97
-
98
-
99
-
100
-
101
-
102
-
103
-
104
-
105
-
 106
106 -
 107
107 -
 108
108 -
 109
109 -
 110
110 -
 111
111 -
 112
112 -
 113
113 -
 114
114 -
 115
115 -
 116
116 -
 117
117 -
 118
118 -
 119
119 -
 120
120
 |
 |

114
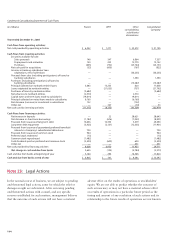
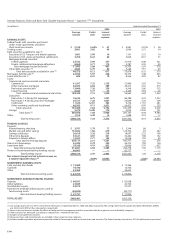
Average Balances,Yields and Rates Paid (Taxable-Equivalent Basis) — Quarterly (1)(2) (Unaudited)
(in millions) Quarter ended December 31,
2005 2004
Average Yields/ Interest Average Yields/ Interest
balance rates income/ balance rates income/
expense expense
EARNING ASSETS
Federal funds sold, securities purchased
under resale agreements and other
short-term investments $ 5,158 3.64% $ 47 $ 4,967 2.01% $ 26
Trading assets 5,061 3.82 48 5,040 2.73 34
Debt securities available for sale (3):
Securities of U.S. Treasury and federal agencies 1,051 3.90 10 1,101 3.72 10
Securities of U.S. states and political subdivisions 3,256 8.22 64 3,624 8.31 71
Mortgage-backed securities:
Federal agencies 23,545 5.94 347 21,916 6.08 321
Private collateralized mortgage obligations 8,060 5.71 114 3,787 5.35 49
Total mortgage-backed securities 31,605 5.88 461 25,703 5.97 370
Other debt securities (4) 4,843 6.79 82 3,246 7.91 59
Total debt securities available for sale (4) 40,755 6.12 617 33,674 6.32 510
Mortgages held for sale (3) 42,036 5.97 628 32,373 5.48 443
Loans held for sale (3) 603 6.41 10 8,536 4.05 87
Loans:
Commercial and commercial real estate:
Commercial 61,297 7.35 1,135 51,896 5.93 774
Other real estate mortgage 28,425 6.84 489 29,412 5.67 419
Real estate construction 13,040 7.26 239 9,246 5.80 135
Lease financing 5,347 5.77 77 5,109 5.84 75
Total commercial and commercial real estate 108,109 7.13 1,940 95,663 5.84 1,403
Consumer:
Real estate 1-4 family first mortgage 76,233 6.75 1,291 86,389 5.70 1,233
Real estate 1-4 family junior lien mortgage 58,157 7.28 1,067 50,909 5.54 709
Credit card 11,326 12.81 363 9,706 11.57 281
Other revolving credit and installment 46,593 9.13 1,071 34,475 8.99 779
Total consumer 192,309 7.84 3,792 181,479 6.59 3,002
Foreign 5,278 13.08 174 4,025 14.00 141
Total loans (5) 305,696 7.68 5,906 281,167 6.44 4,546
Other 1,415 4.49 16 1,698 4.19 17
Total earning assets $400,724 7.23 7,272 $367,455 6.16 5,663
FUNDING SOURCES
Deposits:
Interest-bearing checking $ 3,797 1.79 17 $ 3,244 .68 5
Market rate and other savings 132,042 1.86 619 125,350 .83 262
Savings certificates 26,610 3.26 219 18,697 2.32 108
Other time deposits 33,321 4.07 341 30,460 1.98 152
Deposits in foreign offices 14,347 3.71 135 10,026 1.95 49
Total interest-bearing deposits 210,117 2.51 1,331 187,777 1.22 576
Short-term borrowings 25,395 3.79 242 26,315 1.90 126
Long-term debt 79,169 4.19 832 70,646 2.70 477
Total interest-bearing liabilities 314,681 3.04 2,405 284,738 1.65 1,179
Portion of noninterest-bearing funding sources 86,043 — — 82,717 — —
Total funding sources $400,724 2.39 2,405 $367,455 1.28 1,179
Net interest margin and net interest income on
a taxable-equivalent basis (6) 4.84% $4,867 4.88% $4,484
NONINTEREST-EARNING ASSETS
Cash and due from banks $ 13,508 $ 13,366
Goodwill 10,780 10,436
Other 43,469 34,002
Total noninterest-earning assets $ 67,757 $ 57,804
NONINTEREST-BEARING FUNDING SOURCES
Deposits $ 90,937 $ 82,958
Other liabilities 23,049 20,336
Stockholders’ equity 39,814 37,227
Noninterest-bearing funding sources used to
fund earning assets (86,043) (82,717)
Net noninterest-bearing funding sources $ 67,757 $ 57,804
TOTAL ASSETS $468,481 $425,259
(1) Our average prime rate was 6.97% and 4.94% for the quarters ended December 31, 2005 and 2004, respectively. The average three-month London Interbank Offered Rate (LIBOR)
was 4.34% and 2.30% for the same quarters, respectively.
(2) Interest rates and amounts include the effects of hedge and risk management activities associated with the respective asset and liability categories.
(3) Yields are based on amortized cost balances computed on a settlement date basis.
(4) Includes certain preferred securities.
(5) Nonaccrual loans and related income are included in their respective loan categories.
(6) Includes taxable-equivalent adjustments primarily related to tax-exempt income on certain loans and securities.The federal statutory tax rate was 35% for both quarters presented.
114