Wells Fargo 2005 Annual Report Download - page 97
Download and view the complete annual report
Please find page 97 of the 2005 Wells Fargo annual report below. You can navigate through the pages in the report by either clicking on the pages listed below, or by using the keyword search tool below to find specific information within the annual report.-
 1
1 -
2
-
3
-
4
-
5
-
6
-
7
-
8
-
9
-
10
-
11
-
12
-
13
-
14
-
15
-
16
-
17
-
18
-
19
-
20
-
21
-
22
-
23
-
24
-
25
-
26
-
27
-
28
-
29
-
30
-
31
-
32
-
33
-
34
-
35
-
36
-
37
-
38
-
39
-
40
-
41
-
42
-
43
-
44
-
45
-
46
-
47
-
48
-
49
-
50
-
51
-
52
-
53
-
54
-
55
-
56
-
57
-
58
-
59
-
60
-
61
-
62
-
63
-
64
-
65
-
66
-
67
-
68
-
69
-
70
-
71
-
72
-
73
-
74
-
75
-
76
-
77
-
78
-
79
-
80
-
81
-
82
-
83
-
84
-
85
-
86
-
 87
87 -
 88
88 -
 89
89 -
 90
90 -
 91
91 -
 92
92 -
 93
93 -
 94
94 -
 95
95 -
 96
96 -
 97
97 -
 98
98 -
 99
99 -
 100
100 -
 101
101 -
 102
102 -
 103
103 -
 104
104 -
 105
105 -
 106
106 -
 107
107 -
108
-
109
-
110
-
111
-
112
-
113
-
114
-
115
-
116
-
117
-
118
-
119
-
120
 |
 |

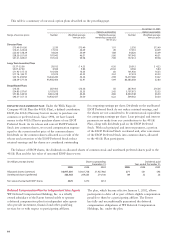
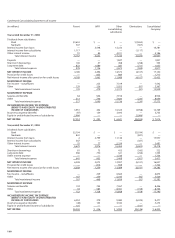
95
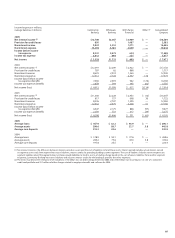
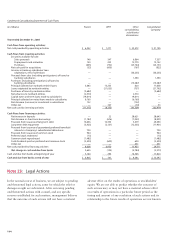
(income/expense in millions,
average balances in billions) Community Wholesale Wells Fargo Other
(2)
Consolidated
Banking Banking Financial
Company
2005
Net interest income (1) $12,708 $2,387 $3,409 $ — $18,504
Provision for credit losses 895 1 1,487 — 2,383
Noninterest income 9,822 3,352 1,271 — 14,445
Noninterest expense 13,294 3,165 2,559 — 19,018
Income before income
tax expense 8,341 2,573 634 — 11,548
Income tax expense 2,812 840 225 —3,877
Net income $ 5,529 $1,733 $ 409 $ — $ 7,671
2004
Net interest income (1) $ 12,019 $ 2,209 $ 2,922 $ — $ 17,150
Provision for credit losses 787 62 868 — 1,717
Noninterest income 8,670 2,974 1,265 — 12,909
Noninterest expense 12,312 2,728 2,357 176 17,573
Income (loss) before income
tax expense (benefit) 7,590 2,393 962 (176) 10,769
Income tax expense (benefit) 2,678 794 345 (62)3,755
Net income (loss) $ 4,912 $ 1,599 $ 617 $(114) $ 7,014
2003
Net interest income (1) $11,360 $ 2,228 $ 2,435 $ (16) $ 16,007
Provision for credit losses 817 177 698 30 1,722
Noninterest income 8,336 2,707 1,339 — 12,382
Noninterest expense 12,332 2,579 2,228 51 17,190
Income (loss) before income
tax expense (benefit) 6,547 2,179 848 (97) 9,477
Income tax expense (benefit) 2,259 733 317 (34)3,275
Net income (loss) $ 4,288 $ 1,446 $ 531 $ (63) $ 6,202
2005
Average loans $ 187.0 $ 62.2 $ 46.9 $ — $ 296.1
Average assets 298.6 88.7 52.7 5.8 445.8
Average core deposits 218.2 24.6 — — 242.8
2004
Average loans $ 178.9 $ 53.1 $ 37.6 $ — $ 269.6
Average assets 284.2 77.6 43.0 5.8 410.6
Average core deposits 197.8 25.5 .1 — 223.4
(1) Net interest income is the difference between interest earned on assets and the cost of liabilities to fund those assets. Interest earned includes actual interest earned
on segment assets and, if the segment has excess liabilities, interest credits for providing funding to other segments.The cost of liabilities includes interest expense on
segment liabilities and, if the segment does not have enough liabilities to fund its assets, a funding charge based on the cost of excess liabilities from another segment.
In general, Community Banking has excess liabilities and receives interest credits for the funding it provides the other segments.
(2) The items recorded at the enterprise level included a $176 million loss on debt extinguishment for 2004 and a $30 million non-recurring loss on sale of a sub-prime
credit card portfolio and $51 million of other charges related to employee benefits and software for 2003.