Wells Fargo 2005 Annual Report Download - page 93
Download and view the complete annual report
Please find page 93 of the 2005 Wells Fargo annual report below. You can navigate through the pages in the report by either clicking on the pages listed below, or by using the keyword search tool below to find specific information within the annual report.-
 1
1 -
2
-
3
-
4
-
5
-
6
-
7
-
8
-
9
-
10
-
11
-
12
-
13
-
14
-
15
-
16
-
17
-
18
-
19
-
20
-
21
-
22
-
23
-
24
-
25
-
26
-
27
-
28
-
29
-
30
-
31
-
32
-
33
-
34
-
35
-
36
-
37
-
38
-
39
-
40
-
41
-
42
-
43
-
44
-
45
-
46
-
47
-
48
-
49
-
50
-
51
-
52
-
53
-
54
-
55
-
56
-
57
-
58
-
59
-
60
-
61
-
62
-
63
-
64
-
65
-
66
-
67
-
68
-
69
-
70
-
71
-
72
-
73
-
74
-
75
-
76
-
77
-
78
-
79
-
80
-
81
-
82
-
 83
83 -
 84
84 -
 85
85 -
 86
86 -
 87
87 -
 88
88 -
 89
89 -
 90
90 -
 91
91 -
 92
92 -
 93
93 -
 94
94 -
 95
95 -
 96
96 -
 97
97 -
 98
98 -
 99
99 -
 100
100 -
 101
101 -
 102
102 -
 103
103 -
104
-
105
-
106
-
107
-
108
-
109
-
110
-
111
-
112
-
113
-
114
-
115
-
116
-
117
-
118
-
119
-
120
 |
 |

91
(in millions) December 31,
2005 2004
Deferred Tax Assets
Allowance for loan losses $1,471 $1,430
Net tax-deferred expenses 179 217
Other 461 402
Total deferred tax assets 2,111 2,049
Deferred Tax Liabilities
Core deposit intangibles 153 188
Leasing 2,430 2,461
Mark to market 708 448
Mortgage servicing 3,517 2,848
FAS 115 adjustment 368 535
FAS 133 adjustment 29 23
Other 501 486
Total deferred tax liabilities 7,706 6,989
Net Deferred Tax Liability $5,595 $4,940
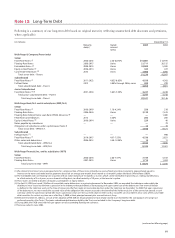
The components of income tax expense were:
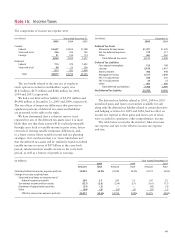
The tax benefit related to the exercise of employee
stock options recorded in stockholders’ equity was
$143 million, $175 million and $148 million for 2005,
2004 and 2003, respectively.
We had a net deferred tax liability of $5,595 million and
$4,940 million at December 31, 2005 and 2004, respectively.
The tax effects of temporary differences that gave rise to
significant portions of deferred tax assets and liabilities
are presented in the table to the right.
We have determined that a valuation reserve is not
required for any of the deferred tax assets since it is more
likely than not that these assets will be realized principally
through carry back to taxable income in prior years, future
reversals of existing taxable temporary differences, and,
to a lesser extent, future taxable income and tax planning
strategies. Our conclusion that it is “more likely than not”
that the deferred tax assets will be realized is based on federal
taxable income in excess of $17 billion in the carry-back
period, substantial state taxable income in the carry-back
period, as well as a history of growth in earnings.
Note 16: Income Taxes
(in millions) Year ended December 31,
2005 2004 2003
Current:
Federal $2,627 $2,815 $1,298
State and local 346 354 165
Foreign 91 154 114
3,064 3,323 1,577
Deferred:
Federal 715 379 1,492
State and local 98 53 206
813 432 1,698
Total $3,877 $3,755 $3,275
The deferred tax liability related to 2005, 2004 or 2003
unrealized gains and losses on securities available for sale
along with the deferred tax liability related to certain derivative
and hedging activities for 2005 and 2004, had no effect on
income tax expense as these gains and losses, net of taxes,
were recorded in cumulative other comprehensive income.
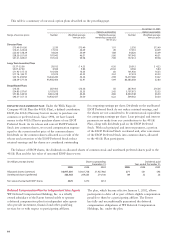
The table below reconciles the statutory federal income
tax expense and rate to the effective income tax expense
and rate.
(in millions) Year ended December 31,
2005 2004 2003
Amount Rate Amount Rate Amount Rate
Statutory federal income tax expense and rate $4,042 35.0% $3,769 35.0% $3,317 35.0%
Change in tax rate resulting from:
State and local taxes on income, net of
federal income tax benefit 289 2.5 265 2.5 241 2.5
Tax-exempt income and tax credits (327) (2.8) (224) (2.1) (161) (1.7)
Donations of appreciated securities (33) (.3) — — (90) (.9)
Other (94)(.8)(55)(.5)(32)(.3)
Effective income tax expense and rate $3,877 33.6% $3,755 34.9% $3,275 34.6%