Wells Fargo 2005 Annual Report Download - page 79
Download and view the complete annual report
Please find page 79 of the 2005 Wells Fargo annual report below. You can navigate through the pages in the report by either clicking on the pages listed below, or by using the keyword search tool below to find specific information within the annual report.-
 1
1 -
2
-
3
-
4
-
5
-
6
-
7
-
8
-
9
-
10
-
11
-
12
-
13
-
14
-
15
-
16
-
17
-
18
-
19
-
20
-
21
-
22
-
23
-
24
-
25
-
26
-
27
-
28
-
29
-
30
-
31
-
32
-
33
-
34
-
35
-
36
-
37
-
38
-
39
-
40
-
41
-
42
-
43
-
44
-
45
-
46
-
47
-
48
-
49
-
50
-
51
-
52
-
53
-
54
-
55
-
56
-
57
-
58
-
59
-
60
-
61
-
62
-
63
-
64
-
65
-
66
-
67
-
68
-
 69
69 -
 70
70 -
 71
71 -
 72
72 -
 73
73 -
 74
74 -
 75
75 -
 76
76 -
 77
77 -
 78
78 -
 79
79 -
 80
80 -
 81
81 -
 82
82 -
 83
83 -
 84
84 -
 85
85 -
 86
86 -
 87
87 -
 88
88 -
 89
89 -
90
-
91
-
92
-
93
-
94
-
95
-
96
-
97
-
98
-
99
-
100
-
101
-
102
-
103
-
104
-
105
-
106
-
107
-
108
-
109
-
110
-
111
-
112
-
113
-
114
-
115
-
116
-
117
-
118
-
119
-
120
 |
 |

77
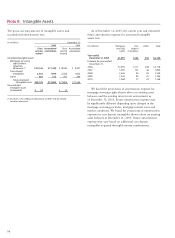
(in millions) Year ended December 31,
2005 2004 2003
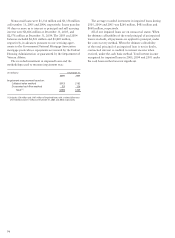
Net gains (losses) from private equity
investments $351 $319 $ (3)
Net gains from all other nonmarketable
equity investments 43 33 116
Net gains from nonmarketable
equity investments $394 $352 $113
(1) At December 31, 2005 and 2004, $3.1 billion and $3.3 billion, respectively,
of nonmarketable equity investments, including all federal bank stock,
were accounted for at cost.
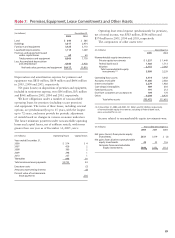
Note 7: Premises, Equipment, Lease Commitments and Other Assets
Operating lease rental expense (predominantly for premises),
net of rental income, was $583 million, $586 million and
$574 million in 2005, 2004 and 2003, respectively.
The components of other assets were:
Depreciation and amortization expense for premises and
equipment was $810 million, $654 million and $666 million
in 2005, 2004 and 2003, respectively.
Net gains (losses) on dispositions of premises and equipment,
included in noninterest expense, were $56 million, $(5) million
and $(46) million in 2005, 2004 and 2003, respectively.
We have obligations under a number of noncancelable
operating leases for premises (including vacant premises)
and equipment. The terms of these leases, including renewal
options, are predominantly up to 15 years, with the longest
up to 72 years, and many provide for periodic adjustment
of rentals based on changes in various economic indicators.
The future minimum payments under noncancelable operating
leases and capital leases, net of sublease rentals, with terms
greater than one year as of December 31, 2005, were:
Income related to nonmarketable equity investments was:
(in millions) December 31,
2005 2004
Land $ 649 $ 585
Buildings 3,617 2,974
Furniture and equipment 3,425 3,110
Leasehold improvements 1,115 1,049
Premises and equipment leased
under capital leases 60 60
Total premises and equipment 8,866 7,778
Less: Accumulated depreciation
and amortization 4,449 3,928
Net book value,premises and equipment $4,417 $3,850
(in millions) Operating leases Capital leases
Year ended December 31,
2006 $ 514 $ 4
2007 426 2
2008 360 2
2009 298 1
2010 237 1
Thereafter 898 14
Total minimum lease payments $2,733 24
Executory costs (2)
Amounts representing interest (8)
Present value of net minimum
lease payments $14
(in millions) December 31,
2005 2004
Nonmarketable equity investments:
Private equity investments $ 1,537 $ 1,449
Federal bank stock 1,402 1,713
All other 2,151 2,067
Total nonmarketable equity
investments (1) 5,090 5,229
Operating lease assets 3,414 3,642
Accounts receivable 11,606 2,682
Interest receivable 2,279 1,483
Core deposit intangibles 489 603
Foreclosed assets 191 212
Due from customers on acceptances 104 170
Other 9,299 8,470
Total other assets $32,472 $22,491
77