Wells Fargo 2005 Annual Report Download - page 119
Download and view the complete annual report
Please find page 119 of the 2005 Wells Fargo annual report below. You can navigate through the pages in the report by either clicking on the pages listed below, or by using the keyword search tool below to find specific information within the annual report.-
 1
1 -
2
-
3
-
4
-
5
-
6
-
7
-
8
-
9
-
10
-
11
-
12
-
13
-
14
-
15
-
16
-
17
-
18
-
19
-
20
-
21
-
22
-
23
-
24
-
25
-
26
-
27
-
28
-
29
-
30
-
31
-
32
-
33
-
34
-
35
-
36
-
37
-
38
-
39
-
40
-
41
-
42
-
43
-
44
-
45
-
46
-
47
-
48
-
49
-
50
-
51
-
52
-
53
-
54
-
55
-
56
-
57
-
58
-
59
-
60
-
61
-
62
-
63
-
64
-
65
-
66
-
67
-
68
-
69
-
70
-
71
-
72
-
73
-
74
-
75
-
76
-
77
-
78
-
79
-
80
-
81
-
82
-
83
-
84
-
85
-
86
-
87
-
88
-
89
-
90
-
91
-
92
-
93
-
94
-
95
-
96
-
97
-
98
-
99
-
100
-
101
-
102
-
103
-
104
-
105
-
106
-
107
-
108
-
 109
109 -
 110
110 -
 111
111 -
 112
112 -
 113
113 -
 114
114 -
 115
115 -
 116
116 -
 117
117 -
 118
118 -
 119
119 -
 120
120
 |
 |
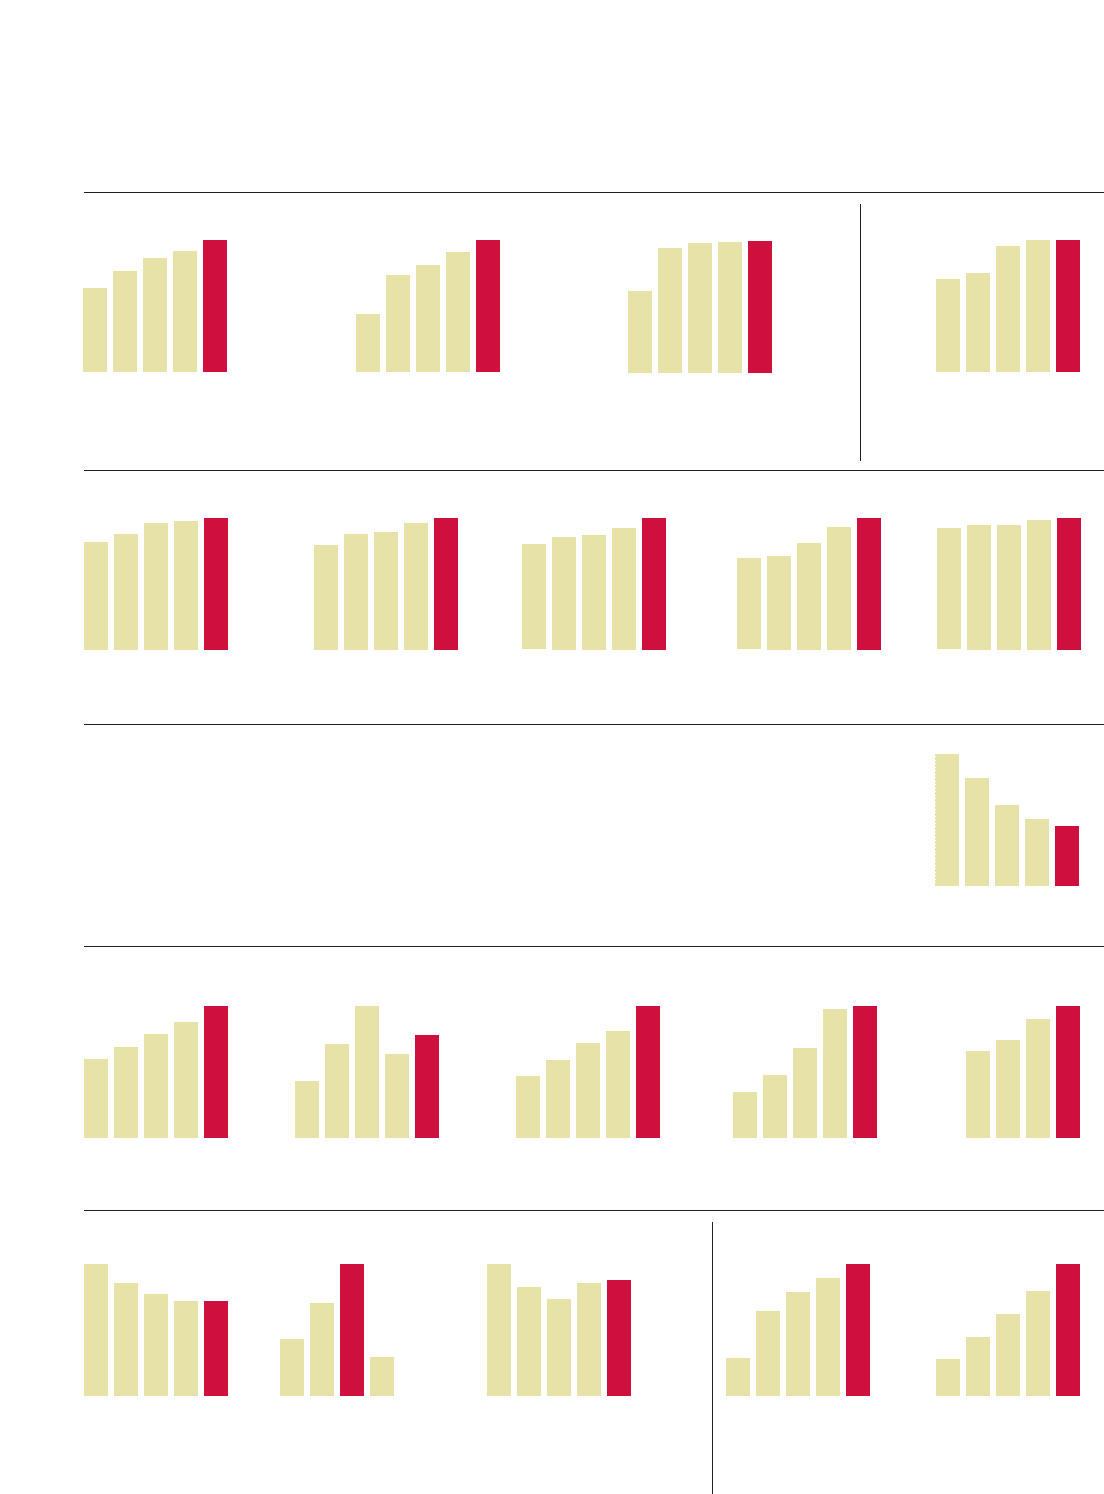
01 02 03 04 05
Revenue (billions)
20-year compound annual growth rate: 12%
$21.0
25.2
28.4
30.1
32.9
02 03 04 05
Active Online Middle-Market/
Large Corporate Customers
(thousands)
18
01
8
22
25
28
02 03 04 05
Active Online
Small Business Customers
(thousands)
297
01
185
415
531
666
01 02 03 04 05
Deposits
(billions)
$187
217
248
275
314
01 02 03 04 05
Mortgage Originations
(billions)
$202
333
470
298
366
01 02 03 04 05
Mortgage Servicing
Portfolio
(billions)
$462
581
710
805
989
National Home Equity
Group Loans
(billions)
01 02 03 04 05
$25
34
49
70
72
Which Measures Really Matter? 2005 Update
01 02 03 04 05
Earnings Per Share diluted**
20-year compound annual growth rate: 14%
$1.97
3.32
3.65
4.09
4.50
01 02 03 04 05
Return on Equity (ROE)
ROE: cents earned for every dollar
stockholders invest in the company
12.7%
18.7
19.4
19.6
19.6
01 02 03 04 05
Retaining Team Members
(annual percent of team members who leave us)
** excludes Wells Fargo Financial
(consumer finance)
34%**
28
25
29
30
01 02 03 04 05
Retaining Customers
(annual percent of high-value* checking
account customers who leave us)
10.4% (est.)
8.9
8.0
* top 20 percent of banking customers
based on balances
7.5
7.5
02 03 04 05
Assets Managed,
Administered
(billions) includes brokerage
$578
654
791
880
02 03 04 05
Nonperforming Assets
(NPAs)/Total Loans
0.88
01
1.08%
0.66
0.55
0.49
02 03 04 05
Products Per Banking
Household
4.2
01
3.8
4.3
4.6
4.8
02 03 04 05
Product Solutions (Sales)
Per Banker* Per Day
4.3
01
4.0
4.7
* platform full-time equivalent (FTE) team member
4.8
4.9
03 04 05
Team Member Engagement
Ratio of engaged to actively disengaged
Gallup survey of Wells Fargo Regional
Banking team members
2.5:1
4.1:1
5.8 :1
1.7 : 1
National average
01 02 03 04 05
Market Capitalization
(billions)
$74
79
100
105
105
The higher a company’s credit rating
(based on its ability to meet debt obli-
gations) the less interest it has to pay
to borrow money.Wells Fargo Bank:
only U.S. bank rated “Aaa.”
Number of S&P companies
Moody’s with higher rating
Wells Fargo Bank,N.A.
Issuer Aaa None
Long-term deposits Aaa None
Financial Strength A None
Wells Fargo & Company
Subordinated Debt Aa2 One
Issuer Aa1 Six
Senior Debt Aa1 Six
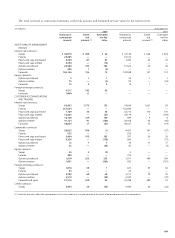
Financial Performance*
Retaining Customers,Team Members
Sales
Online
Earning More Business
Managing Risk
In our past two annual reports, we said to you,our owners,that we
measure success differently than our competitors—to reflect more
accurately how financial services companies, like ours, create value
for customers and stockholders.Here’s an update on the progress
we’re making in the areas we believe are the best long-term
indicators for future success in the financial services industry.
02 03 04 05
Commercial/Corporate
Products Per Banking
Customer
4.9
01
4.6
5.0
5.3
5.7
02 03 04 05
Retail Banking Households
with Credit Cards
23.7
01
23.2%
26.9
31.1
33.1
02 03 04 05
Retail Checking Households
with Debit Cards
85.4
01
83.3%
85.9
88.7
90.5
* before effect of change in accounting principles,2001 includes venture capital impairment
** includes all common stock equivalents (”in the money stock”options,warrants and rights,convertible bonds and convertible preferred stock)