Wells Fargo 2005 Annual Report Download - page 65
Download and view the complete annual report
Please find page 65 of the 2005 Wells Fargo annual report below. You can navigate through the pages in the report by either clicking on the pages listed below, or by using the keyword search tool below to find specific information within the annual report.-
 1
1 -
2
-
3
-
4
-
5
-
6
-
7
-
8
-
9
-
10
-
11
-
12
-
13
-
14
-
15
-
16
-
17
-
18
-
19
-
20
-
21
-
22
-
23
-
24
-
25
-
26
-
27
-
28
-
29
-
30
-
31
-
32
-
33
-
34
-
35
-
36
-
37
-
38
-
39
-
40
-
41
-
42
-
43
-
44
-
45
-
46
-
47
-
48
-
49
-
50
-
51
-
52
-
53
-
54
-
 55
55 -
 56
56 -
 57
57 -
 58
58 -
 59
59 -
 60
60 -
 61
61 -
 62
62 -
 63
63 -
 64
64 -
 65
65 -
 66
66 -
 67
67 -
 68
68 -
 69
69 -
 70
70 -
 71
71 -
 72
72 -
 73
73 -
 74
74 -
 75
75 -
76
-
77
-
78
-
79
-
80
-
81
-
82
-
83
-
84
-
85
-
86
-
87
-
88
-
89
-
90
-
91
-
92
-
93
-
94
-
95
-
96
-
97
-
98
-
99
-
100
-
101
-
102
-
103
-
104
-
105
-
106
-
107
-
108
-
109
-
110
-
111
-
112
-
113
-
114
-
115
-
116
-
117
-
118
-
119
-
120
 |
 |

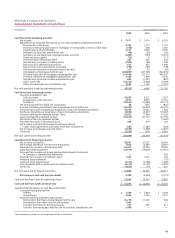
63
Wells Fargo & Company and Subsidiaries
Consolidated Statement of Cash Flows
(in millions) Year ended December 31,
2005 2004 2003
Cash flows from operating activities:
Net income $ 7,671 $ 7,014 $ 6,202
Adjustments to reconcile net income to net cash provided by operating activities:
Provision for credit losses 2,383 1,717 1,722
Provision (reversal of provision) for mortgage servicing rights in excess of fair value (378) (208) 1,092
Depreciation and amortization 4,161 3,449 4,305
Net gains on securities available for sale (40) (60) (62)
Net gains on mortgage loan origination/sales activities (1,085) (539) (3,019)
Other net losses (gains) (75) 9 (11)
Preferred shares released to ESOP 307 265 224
Net decrease (increase) in trading assets (1,905) (81) 1,248
Net increase in deferred income taxes 813 432 1,698
Net increase in accrued interest receivable (796) (196) (148)
Net increase (decrease) in accrued interest payable 311 47 (63)
Originations of mortgages held for sale (230,897) (221,978) (382,335)
Proceeds from sales of mortgages originated for sale 214,740 217,272 404,207
Principal collected on mortgages originated for sale 1,426 1,409 3,136
Net decrease (increase) in loans originated for sale 683 (1,331) (832)
Other assets, net (10,237) (2,468) (5,099)
Other accrued expenses and liabilities, net 3,585 1,732 (1,070)
Net cash provided (used) by operating activities (9,333) 6,485 31,195
Cash flows from investing activities:
Securities available for sale:
Sales proceeds 19,059 6,322 7,357
Prepayments and maturities 6,972 8,823 13,152
Purchases (28,634) (16,583) (25,131)
Net cash acquired from (paid for) acquisitions 66 (331) (822)
Increase in banking subsidiaries’ loan originations, net of collections (42,309) (33,800) (36,235)
Proceeds from sales (including participations) of loans by banking subsidiaries 42,239 14,540 1,590
Purchases (including participations) of loans by banking subsidiaries (8,853) (5,877) (15,087)
Principal collected on nonbank entities’ loans 22,822 17,996 17,638
Loans originated by nonbank entities (33,675) (27,751) (21,792)
Purchases of loans by nonbank entities —— (3,682)
Proceeds from sales of foreclosed assets 444 419 264
Net increase in federal funds sold, securities purchased
under resale agreements and other short-term investments (281) (1,287) (208)
Net increase in mortgage servicing rights (4,595) (1,389) (3,875)
Other, net (3,324) (516) 3,852
Net cash used by investing activities (30,069) (39,434) (62,979)
Cash flows from financing activities:
Net increase in deposits 38,961 27,327 28,643
Net increase (decrease) in short-term borrowings 1,878 (2,697) (8,901)
Proceeds from issuance of long-term debt 26,473 29,394 29,490
Long-term debt repayment (18,576) (19,639) (17,931)
Proceeds from issuance of guaranteed preferred beneficial interests
in Company’s subordinated debentures —— 700
Proceeds from issuance of common stock 1,367 1,271 944
Preferred stock redeemed —— (73)
Common stock repurchased (3,159) (2,188) (1,482)
Cash dividends paid on preferred and common stock (3,375) (3,150) (2,530)
Other, net (1,673) (13) 651
Net cash provided by financing activities 41,896 30,305 29,511
Net change in cash and due from banks 2,494 (2,644) (2,273)
Cash and due from banks at beginning of year 12,903 15,547 17,820
Cash and due from banks at end of year $ 15,397 $ 12,903 $ 15,547
Supplemental disclosures of cash flow information:
Cash paid during the year for:
Interest $ 7,769 $ 3,864 $ 3,348
Income taxes 3,584 2,326 2,713
Noncash investing and financing activities:
Net transfers from loans to mortgages held for sale 41,270 11,225 368
Net transfers from loans held for sale to loans 7,444 ——
Transfers from loans to foreclosed assets 567 603 411
Transfers from mortgages held for sale to securities available for sale 5,490 ——
The accompanying notes are an integral part of these statements.