Wells Fargo 2005 Annual Report Download - page 102
Download and view the complete annual report
Please find page 102 of the 2005 Wells Fargo annual report below. You can navigate through the pages in the report by either clicking on the pages listed below, or by using the keyword search tool below to find specific information within the annual report.-
 1
1 -
2
-
3
-
4
-
5
-
6
-
7
-
8
-
9
-
10
-
11
-
12
-
13
-
14
-
15
-
16
-
17
-
18
-
19
-
20
-
21
-
22
-
23
-
24
-
25
-
26
-
27
-
28
-
29
-
30
-
31
-
32
-
33
-
34
-
35
-
36
-
37
-
38
-
39
-
40
-
41
-
42
-
43
-
44
-
45
-
46
-
47
-
48
-
49
-
50
-
51
-
52
-
53
-
54
-
55
-
56
-
57
-
58
-
59
-
60
-
61
-
62
-
63
-
64
-
65
-
66
-
67
-
68
-
69
-
70
-
71
-
72
-
73
-
74
-
75
-
76
-
77
-
78
-
79
-
80
-
81
-
82
-
83
-
84
-
85
-
86
-
87
-
88
-
89
-
90
-
91
-
 92
92 -
 93
93 -
 94
94 -
 95
95 -
 96
96 -
 97
97 -
 98
98 -
 99
99 -
 100
100 -
 101
101 -
 102
102 -
 103
103 -
 104
104 -
 105
105 -
 106
106 -
 107
107 -
 108
108 -
 109
109 -
 110
110 -
 111
111 -
 112
112 -
113
-
114
-
115
-
116
-
117
-
118
-
119
-
120
 |
 |

100
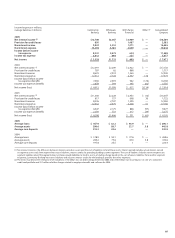
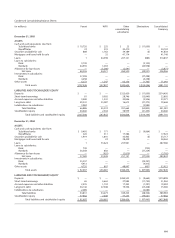
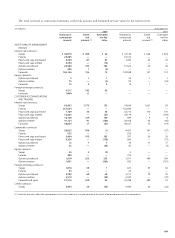
Condensed Consolidating Statements of Income
(in millions) Parent WFFI Other Eliminations Consolidated
consolidating Company
subsidiaries
Year ended December 31, 2004
Dividends from subsidiaries:
Bank $3,652 $ — $ — $(3,652) $ —
Nonbank 307 — — (307) —
Interest income from loans — 3,548 13,233 — 16,781
Interest income from subsidiaries 1,117 — — (1,117) —
Other interest income 91 84 4,011 —4,186
Total interest income 5,167 3,632 17,244 (5,076) 20,967
Deposits — — 1,827 — 1,827
Short-term borrowings 106 47 458 (258) 353
Long-term debt 872 1,089 387 (711) 1,637
Total interest expense 978 1,136 2,672 (969) 3,817
NET INTEREST INCOME 4,189 2,496 14,572 (4,107) 17,150
Provision for credit losses —833 884 —1,717
Net interest income after provision for credit losses 4,189 1,663 13,688 (4,107) 15,433
NONINTEREST INCOME
Fee income –nonaffiliates — 223 7,319 — 7,542
Other 139 256 5,053 (81)5,367
Total noninterest income 139 479 12,372 (81)12,909
NONINTEREST EXPENSE
Salaries and benefits 64 944 7,916 — 8,924
Other 313 746 7,820 (230) 8,649
Total noninterest expense 377 1,690 15,736 (230) 17,573
INCOME BEFORE INCOME TAX EXPENSE
(BENEFIT) AND EQUITY IN UNDISTRIBUTED
INCOME OF SUBSIDIARIES 3,951 452 10,324 (3,958) 10,769
Income tax expense (benefit) (97) 159 3,693 — 3,755
Equity in undistributed income of subsidiaries 2,966 — — (2,966) —
NET INCOME $7,014 $ 293 $ 6,631 $(6,924) $ 7,014
Year ended December 31, 2003
Dividends from subsidiaries:
Bank $5,194 $ — $ — $(5,194) $ —
Nonbank 841 — — (841) —
Interest income from loans 2 2,799 11,136 — 13,937
Interest income from subsidiaries 567 — — (567) —
Other interest income 75 77 5,329 —5,481
Total interest income 6,679 2,876 16,465 (6,602) 19,418
Short-term borrowings 81 73 413 (245) 322
Long-term debt 560 730 321 (256) 1,355
Other interest expense — — 1,734 —1,734
Total interest expense 641 803 2,468 (501) 3,411
NET INTEREST INCOME 6,038 2,073 13,997 (6,101) 16,007
Provision for credit losses — 814 908 —1,722
Net interest income after provision for credit losses 6,038 1,259 13,089 (6,101) 14,285
NONINTEREST INCOME
Fee income –nonaffiliates — 209 6,664 — 6,873
Other 167 239 5,195 (92)5,509
Total noninterest income 167 448 11,859 (92)12,382
NONINTEREST EXPENSE
Salaries and benefits 134 745 7,567 — 8,446
Other 18 583 8,301 (158) 8,744
Total noninterest expense 152 1,328 15,868 (158) 17,190
INCOME BEFORE INCOME TAX EXPENSE
(BENEFIT) AND EQUITY IN UNDISTRIBUTED
INCOME OF SUBSIDIARIES 6,053 379 9,080 (6,035) 9,477
Income tax expense (benefit) (48) 143 3,180 — 3,275
Equity in undistributed income of subsidiaries 101 — — (101) —
NET INCOME $6,202 $ 236 $ 5,900 $(6,136) $ 6,202