Wells Fargo 2005 Annual Report Download - page 44
Download and view the complete annual report
Please find page 44 of the 2005 Wells Fargo annual report below. You can navigate through the pages in the report by either clicking on the pages listed below, or by using the keyword search tool below to find specific information within the annual report.-
 1
1 -
2
-
3
-
4
-
5
-
6
-
7
-
8
-
9
-
10
-
11
-
12
-
13
-
14
-
15
-
16
-
17
-
18
-
19
-
20
-
21
-
22
-
23
-
24
-
25
-
26
-
27
-
28
-
29
-
30
-
31
-
32
-
33
-
 34
34 -
 35
35 -
 36
36 -
 37
37 -
 38
38 -
 39
39 -
 40
40 -
 41
41 -
 42
42 -
 43
43 -
 44
44 -
 45
45 -
 46
46 -
 47
47 -
 48
48 -
 49
49 -
 50
50 -
 51
51 -
 52
52 -
 53
53 -
 54
54 -
55
-
56
-
57
-
58
-
59
-
60
-
61
-
62
-
63
-
64
-
65
-
66
-
67
-
68
-
69
-
70
-
71
-
72
-
73
-
74
-
75
-
76
-
77
-
78
-
79
-
80
-
81
-
82
-
83
-
84
-
85
-
86
-
87
-
88
-
89
-
90
-
91
-
92
-
93
-
94
-
95
-
96
-
97
-
98
-
99
-
100
-
101
-
102
-
103
-
104
-
105
-
106
-
107
-
108
-
109
-
110
-
111
-
112
-
113
-
114
-
115
-
116
-
117
-
118
-
119
-
120
 |
 |

42
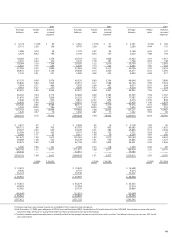
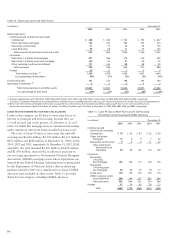
Table 3: Average Balances,Yields and Rates Paid (Taxable-Equivalent Basis) (1)(2)
(in millions) 2005 2004
Average Yields/ Interest Average Yields/ Interest
balance rates income/ balance rates income/
expense expense
EARNING ASSETS
Federal funds sold, securities purchased under
resale agreements and other short-term investments $ 5,448 3.01% $ 164 $ 4,254 1.49% $ 64
Trading assets 5,411 3.52 190 5,286 2.75 145
Debt securities available for sale
(3)
:
Securities of U.S. Treasury and federal agencies 997 3.81 38 1,161 4.05 46
Securities of U.S. states and political subdivisions 3,395 8.27 266 3,501 8.00 267
Mortgage-backed securities:
Federal agencies 19,768 6.02 1,162 21,404 6.03 1,248
Private collateralized mortgage obligations 5,128 5.60 283 3,604 5.16 180
Total mortgage-backed securities 24,896 5.94 1,445 25,008 5.91 1,428
Other debt securities (4) 3,846 7.10 266 3,395 7.72 236
Total debt securities available for sale
(4)
33,134 6.24 2,015 33,065 6.24 1,977
Mortgages held for sale (3) 38,986 5.67 2,213 32,263 5.38 1,737
Loans held for sale (3) 2,857 5.10 146 8,201 3.56 292
Loans:
Commercial and commercial real estate:
Commercial 58,434 6.76 3,951 49,365 5.77 2,848
Other real estate mortgage 29,098 6.31 1,836 28,708 5.35 1,535
Real estate construction 11,086 6.67 740 8,724 5.30 463
Lease financing 5,226 5.91 309 5,068 6.23 316
Total commercial and commercial real estate 103,844 6.58 6,836 91,865 5.62 5,162
Consumer:
Real estate 1-4 family first mortgage 78,170 6.42 5,016 87,700 5.44 4,772
Real estate 1-4 family junior lien mortgage 55,616 6.61 3,679 44,415 5.18 2,300
Credit card 10,663 12.33 1,315 8,878 11.80 1,048
Other revolving credit and installment 43,102 8.80 3,794 33,528 9.01 3,022
Total consumer 187,551 7.36 13,804 174,521 6.38 11,142
Foreign 4,711 13.49 636 3,184 15.30 487
Total loans (5) 296,106 7.19 21,276 269,570 6.23 16,791
Other 1,581 4.34 68 1,709 3.81 65
Total earning assets $383,523 6.81 26,072 $354,348 5.97 21,071
FUNDING SOURCES
Deposits:
Interest-bearing checking $ 3,607 1.43 51 $ 3,059 .44 13
Market rate and other savings 129,291 1.45 1,874 122,129 .69 838
Savings certificates 22,638 2.90 656 18,850 2.26 425
Other time deposits 27,676 3.29 910 29,750 1.43 427
Deposits in foreign offices 11,432 3.12 357 8,843 1.40 124
Total interest-bearing deposits 194,644 1.98 3,848 182,631 1.00 1,827
Short-term borrowings 24,074 3.09 744 26,130 1.35 353
Long-term debt 79,137 3.62 2,866 67,898 2.41 1,637
Guaranteed preferred beneficial interests in Company’s
subordinated debentures (6) — — — — — —
Total interest-bearing liabilities 297,855 2.50 7,458 276,659 1.38 3,817
Portion of noninterest-bearing funding sources 85,668 — — 77,689 — —
Total funding sources $383,523 1.95 7,458 $354,348 1.08 3,817
Net interest margin and net interest income on
a taxable-equivalent basis (7) 4.86% $18,614 4.89% $17,254
NONINTEREST-EARNING ASSETS
Cash and due from banks $ 13,173 $ 13,055
Goodwill 10,705 10,418
Other 38,389 32,758
Total noninterest-earning assets $ 62,267 $ 56,231
NONINTEREST-BEARING FUNDING SOURCES
Deposits $ 87,218 $ 79,321
Other liabilities 21,559 18,764
Stockholders’ equity 39,158 35,835
Noninterest-bearing funding sources used to
fund earning assets (85,668) (77,689)
Net noninterest-bearing funding sources $ 62,267 $ 56,231
TOTAL ASSETS $445,790 $410,579
(1) Our average prime rate was 6.19%, 4.34%, 4.12%, 4.68% and 6.91% for 2005, 2004, 2003, 2002 and 2001, respectively.The average three-month London Interbank
Offered Rate (LIBOR) was 3.56%, 1.62%, 1.22%, 1.80% and 3.78% for the same years, respectively.
(2) Interest rates and amounts include the effects of hedge and risk management activities associated with the respective asset and liability categories.
(3) Yields are based on amortized cost balances computed on a settlement date basis.
(4) Includes certain preferred securities.