Wells Fargo 2005 Annual Report Download - page 105
Download and view the complete annual report
Please find page 105 of the 2005 Wells Fargo annual report below. You can navigate through the pages in the report by either clicking on the pages listed below, or by using the keyword search tool below to find specific information within the annual report.-
 1
1 -
2
-
3
-
4
-
5
-
6
-
7
-
8
-
9
-
10
-
11
-
12
-
13
-
14
-
15
-
16
-
17
-
18
-
19
-
20
-
21
-
22
-
23
-
24
-
25
-
26
-
27
-
28
-
29
-
30
-
31
-
32
-
33
-
34
-
35
-
36
-
37
-
38
-
39
-
40
-
41
-
42
-
43
-
44
-
45
-
46
-
47
-
48
-
49
-
50
-
51
-
52
-
53
-
54
-
55
-
56
-
57
-
58
-
59
-
60
-
61
-
62
-
63
-
64
-
65
-
66
-
67
-
68
-
69
-
70
-
71
-
72
-
73
-
74
-
75
-
76
-
77
-
78
-
79
-
80
-
81
-
82
-
83
-
84
-
85
-
86
-
87
-
88
-
89
-
90
-
91
-
92
-
93
-
94
-
 95
95 -
 96
96 -
 97
97 -
 98
98 -
 99
99 -
 100
100 -
 101
101 -
 102
102 -
 103
103 -
 104
104 -
 105
105 -
 106
106 -
 107
107 -
 108
108 -
 109
109 -
 110
110 -
 111
111 -
 112
112 -
 113
113 -
 114
114 -
 115
115 -
116
-
117
-
118
-
119
-
120
 |
 |

103
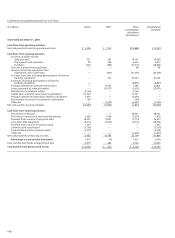
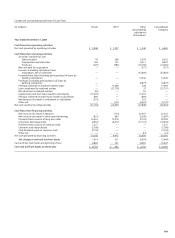
Condensed Consolidating Statement of Cash Flows
(in millions) Parent WFFI Other Consolidated
consolidating Company
subsidiaries/
eliminations
Year ended December 31, 2004
Cash flows from operating activities:
Net cash provided by operating activities $ 3,848 $1,297 $1,340 $ 6,485
Cash flows from investing activities:
Securities available for sale:
Sales proceeds 78 268 5,976 6,322
Prepayments and maturities 160 152 8,511 8,823
Purchases (207) (580) (15,796) (16,583)
Net cash paid for acquisitions — — (331) (331)
Increase in banking subsidiaries’ loan
originations, net of collections — — (33,800) (33,800)
Proceeds from sales (including participations) of loans by
banking subsidiaries — — 14,540 14,540
Purchases (including participations) of loans by
banking subsidiaries — — (5,877) (5,877)
Principal collected on nonbank entities’loans — 17,668 328 17,996
Loans originated by nonbank entities — (27,778) 27 (27,751)
Net advances to nonbank entities (92) — 92 —
Capital notes and term loans made to subsidiaries (11,676) — 11,676 —
Principal collected on notes/loans made to subsidiaries 896 — (896) —
Net decrease (increase) in investment in subsidiaries (353) — 353 —
Other, net — (121) (2,652) (2,773)
Net cash used by investing activities (11,194) (10,391) (17,849) (39,434)
Cash flows from financing activities:
Net increase (decrease) in deposits — (110) 27,437 27,327
Net increase (decrease) in short-term borrowings (831) 683 (2,549) (2,697)
Proceeds from issuance of long-term debt 19,610 12,919 (3,135) 29,394
Long-term debt repayment (4,452) (4,077) (11,110) (19,639)
Proceeds from issuance of common stock 1,271 — — 1,271
Common stock repurchased (2,188) — — (2,188)
Cash dividends paid on common stock (3,150) — — (3,150)
Other, net — — (13)(13)
Net cash provided by financing activities 10,260 9,415 10,630 30,305
Net change in cash and due from banks 2,914 321 (5,879) (2,644)
Cash and due from banks at beginning of year 6,805 161 8,581 15,547
Cash and due from banks at end of year $ 9,719 $ 482 $ 2,702 $ 12,903