Wells Fargo 2005 Annual Report Download - page 36
Download and view the complete annual report
Please find page 36 of the 2005 Wells Fargo annual report below. You can navigate through the pages in the report by either clicking on the pages listed below, or by using the keyword search tool below to find specific information within the annual report.-
 1
1 -
2
-
3
-
4
-
5
-
6
-
7
-
8
-
9
-
10
-
11
-
12
-
13
-
14
-
15
-
16
-
17
-
18
-
19
-
20
-
21
-
22
-
23
-
24
-
25
-
 26
26 -
 27
27 -
 28
28 -
 29
29 -
 30
30 -
 31
31 -
 32
32 -
 33
33 -
 34
34 -
 35
35 -
 36
36 -
 37
37 -
 38
38 -
 39
39 -
 40
40 -
 41
41 -
 42
42 -
 43
43 -
 44
44 -
 45
45 -
 46
46 -
47
-
48
-
49
-
50
-
51
-
52
-
53
-
54
-
55
-
56
-
57
-
58
-
59
-
60
-
61
-
62
-
63
-
64
-
65
-
66
-
67
-
68
-
69
-
70
-
71
-
72
-
73
-
74
-
75
-
76
-
77
-
78
-
79
-
80
-
81
-
82
-
83
-
84
-
85
-
86
-
87
-
88
-
89
-
90
-
91
-
92
-
93
-
94
-
95
-
96
-
97
-
98
-
99
-
100
-
101
-
102
-
103
-
104
-
105
-
106
-
107
-
108
-
109
-
110
-
111
-
112
-
113
-
114
-
115
-
116
-
117
-
118
-
119
-
120
 |
 |

34
Wells Fargo & Company is a $482 billion diversified financial
services company providing banking, insurance, investments,
mortgage banking and consumer finance through banking
stores, the internet and other distribution channels to con-
sumers, businesses and institutions in all 50 states of the
U.S. and in other countries. We ranked fifth in assets and
fourth in market value of our common stock among U.S.
bank holding companies at December 31, 2005. When we
refer to “the Company,” “we,” “our” and “us” in this
Report, we mean Wells Fargo & Company and Subsidiaries
(consolidated). When we refer to “the Parent,” we mean
Wells Fargo & Company.
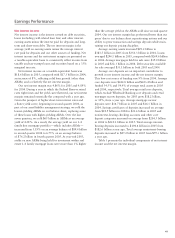
We had another exceptional year in 2005, with record
diluted earnings per share of $4.50, record net income of
$7.7 billion and solid market share growth across our more
than 80 businesses. Our earnings growth from a year ago was
broad based, with nearly every consumer and commercial
business line achieving double-digit profit growth, including
regional banking, private client services, corporate trust,
business direct, asset-based lending, student lending, consumer
credit, commercial real estate and international trade services.
Both net interest income and noninterest income for 2005
grew solidly from last year and virtually all of our fee-based
products had double-digit revenue growth. We took significant
actions to reposition our balance sheet in 2005 designed to
improve yields on earning assets, including the sale of $48 billion
of our lowest-yielding adjustable rate mortgages (ARMs),
resulting in $119 million of sales-related losses, and the
sale of $17 billion of debt securities, including low-yielding
fixed-income securities, resulting in $120 million of losses.
Our growth in earnings per share was driven by revenue
growth, operating leverage (revenue growth in excess of
expense growth) and credit quality, which remained solid
despite the following credit-related events:
• $171 million of net charge-offs from incremental
consumer bankruptcy filings nationwide due to a
change in bankruptcy law in October 2005;
• $163 million first quarter 2005 initial implementation
of conforming to more stringent Federal Financial
Institutions Examination Council (FFIEC) charge-off
rules at Wells Fargo Financial; and
• $100 million provision for credit losses for our
assessment of the effect of Hurricane Katrina.
Our primary sources of earnings are driven by lending
and deposit taking activities, which generate net interest
income, and providing financial services that generate fee
income.
Revenue grew 10% from 2004. In addition to double-digit
growth in earnings per share, we also had double-digit growth
in average loans. We have been achieving these results not just
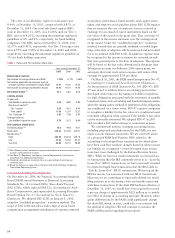
for one year, but for the past five, 10, 15 and 20 years. Our
total shareholder return the past five years was 10 times that
of the S&P 500®
, and almost double the S&P 500 including
the past 10, 15 and 20 years. These periods included almost
every economic cycle and economic condition a financial
institution can experience, including high and low interest
rates, high and low unemployment, bubbles and recessions
and all types of yield curves – steep, flat and inverted. For us
to achieve double-digit growth through different economic
cycles, our primary strategy, consistent for 20 years, is to
satisfy all our customers’ financial needs, help them succeed
financially and, through cross-selling, gain market share,
wallet share and earn 100% of their business.
We have stated in the past that to consistently grow
over the long term, successful companies must invest in their
core businesses and in maintaining strong balance sheets.
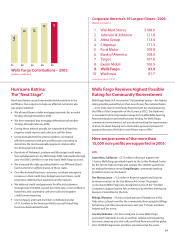
We continued to make investments in 2005 by opening 92
banking stores, seven commercial banking offices, 47 mortgage
stores and 20 consumer finance stores. We continued to
be #1 nationally in retail mortgage originations, home
equity lending, small business lending, agricultural lending,
consumer internet banking, and providing financial services
to middle-market companies in the western U.S.
Overview
This Annual Report, including the Financial Review and the Financial Statements and related Notes, has forward-looking
statements, which may include forecasts of our financial results and condition, expectations for our operations and business, and
our assumptions for those forecasts and expectations. Do not unduly rely on forward-looking statements. Actual results might
differ significantly from our forecasts and expectations due to several factors. Some of these factors are described in the Financial
Review and in the Financial Statements and related Notes. For a discussion of other factors, refer to the “Risk Factors” and
“Regulation and Supervision” sections of our Annual Report on Form 10-K for the year ended December 31, 2005, filed with
the Securities and Exchange Commission (SEC) and available on the SEC’s website at www.sec.gov.
5%
.5
17
12
21
11
10 15 205 years
(percent) Wells Fargo Common Stock S&P 500
LONG-TERM PERFORMANCE – TOTAL COMPOUND ANNUAL
STOCKHOLDER RETURN (Including reinvestment of dividends)
21
9
Financial Review