Wells Fargo 2005 Annual Report Download - page 111
Download and view the complete annual report
Please find page 111 of the 2005 Wells Fargo annual report below. You can navigate through the pages in the report by either clicking on the pages listed below, or by using the keyword search tool below to find specific information within the annual report.-
 1
1 -
2
-
3
-
4
-
5
-
6
-
7
-
8
-
9
-
10
-
11
-
12
-
13
-
14
-
15
-
16
-
17
-
18
-
19
-
20
-
21
-
22
-
23
-
24
-
25
-
26
-
27
-
28
-
29
-
30
-
31
-
32
-
33
-
34
-
35
-
36
-
37
-
38
-
39
-
40
-
41
-
42
-
43
-
44
-
45
-
46
-
47
-
48
-
49
-
50
-
51
-
52
-
53
-
54
-
55
-
56
-
57
-
58
-
59
-
60
-
61
-
62
-
63
-
64
-
65
-
66
-
67
-
68
-
69
-
70
-
71
-
72
-
73
-
74
-
75
-
76
-
77
-
78
-
79
-
80
-
81
-
82
-
83
-
84
-
85
-
86
-
87
-
88
-
89
-
90
-
91
-
92
-
93
-
94
-
95
-
96
-
97
-
98
-
99
-
100
-
 101
101 -
 102
102 -
 103
103 -
 104
104 -
 105
105 -
 106
106 -
 107
107 -
 108
108 -
 109
109 -
 110
110 -
 111
111 -
 112
112 -
 113
113 -
 114
114 -
 115
115 -
 116
116 -
 117
117 -
 118
118 -
 119
119 -
 120
120
 |
 |

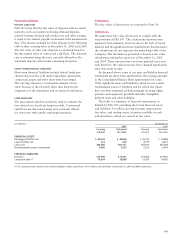
109
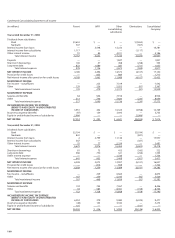
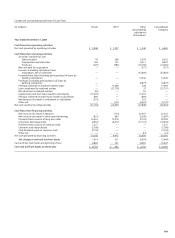
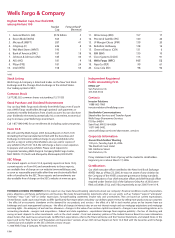
(in millions) December 31,
2005 2004
Notional or Credit Estimated Notional or Credit Estimated
contractual risk net fair contractual risk net fair
amount amount
(1) value amount amount(1) value
ASSET/LIABILITY MANAGEMENT
HEDGES
Interest rate contracts:
Swaps $ 36,978 $ 409 $ 26 $ 27,145 $ 626 $ 524
Futures 25,485 — — 10,314 — —
Floors and caps purchased 5,250 87 87 1,400 25 25
Floors and caps written 5,250 — (13) ———
Options purchased 26,508 103 103 51,670 49 49
Options written 405 1 (3) ———
Forwards 106,146 126 18 103,948 137 113
Equity contracts:
Options purchased 31 1 25 1 1
Options written 75 — (3) 99 — (18)
Forwards 15 2 2 19 1 —
Foreign exchange contracts:
Swaps 4,217 142 93 ———
Forwards 1,000 11 — ———
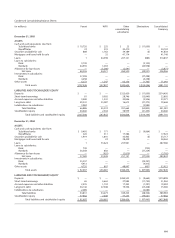
CUSTOMER ACCOMMODATIONS
AND TRADING
Interest rate contracts:
Swaps 92,462 1,175 133 74,659 1,631 28
Futures 251,534 — — 152,943 — —
Floors and caps purchased 7,169 33 33 32,715 170 170
Floors and caps written 12,653 — (27) 34,119 1 (189)
Options purchased 10,160 129 129 699 4 4
Options written 41,124 41 (160) 26,418 45 (45)
Forwards 56,644 17 (61) 46,167 13 (19)
Commodity contracts:
Swaps 20,633 599 (1) 4,427 141 (27)
Futures 555 — — 230 — —
Floors and caps purchased 5,464 195 195 391 39 39
Floors and caps written 6,356 — (130) 609 — (37)
Options purchased 12 7 7 35 17 17
Options written 52 — (33) 42 — (6)
Equity contracts:
Swaps 55 5 (2) 4——
Futures 480 — — 730 — —
Options purchased 1,810 253 253 1,011 189 189
Options written 1,601 — (263) 935 — (181)
Foreign exchange contracts:
Swaps 1,078 35 1 673 53 52
Futures 53 — — 24 — —
Options purchased 2,280 60 60 2,211 79 79
Options written 2,219 — (59) 2,187 — (79)
Forwards and spots 21,516 220 22 25,788 489 19
Credit contracts:
Swaps 5,454 23 (33) 5,443 36 (22)
The total notional or contractual amounts, credit risk amount and estimated net fair value for derivatives were:
(1) Credit risk amounts reflect the replacement cost for those contracts in a gain position in the event of nonperformance by all counterparties.