Wells Fargo 2005 Annual Report Download - page 90
Download and view the complete annual report
Please find page 90 of the 2005 Wells Fargo annual report below. You can navigate through the pages in the report by either clicking on the pages listed below, or by using the keyword search tool below to find specific information within the annual report.-
 1
1 -
2
-
3
-
4
-
5
-
6
-
7
-
8
-
9
-
10
-
11
-
12
-
13
-
14
-
15
-
16
-
17
-
18
-
19
-
20
-
21
-
22
-
23
-
24
-
25
-
26
-
27
-
28
-
29
-
30
-
31
-
32
-
33
-
34
-
35
-
36
-
37
-
38
-
39
-
40
-
41
-
42
-
43
-
44
-
45
-
46
-
47
-
48
-
49
-
50
-
51
-
52
-
53
-
54
-
55
-
56
-
57
-
58
-
59
-
60
-
61
-
62
-
63
-
64
-
65
-
66
-
67
-
68
-
69
-
70
-
71
-
72
-
73
-
74
-
75
-
76
-
77
-
78
-
79
-
 80
80 -
 81
81 -
 82
82 -
 83
83 -
 84
84 -
 85
85 -
 86
86 -
 87
87 -
 88
88 -
 89
89 -
 90
90 -
 91
91 -
 92
92 -
 93
93 -
 94
94 -
 95
95 -
 96
96 -
 97
97 -
 98
98 -
 99
99 -
 100
100 -
101
-
102
-
103
-
104
-
105
-
106
-
107
-
108
-
109
-
110
-
111
-
112
-
113
-
114
-
115
-
116
-
117
-
118
-
119
-
120
 |
 |

88
(in millions) Year ended December 31,
2005 2004
Pension benefits Pension benefits
Non- Other Non- Other
Qualified qualified benefits Qualified qualified benefits
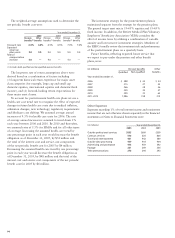
Fair value of plan assets at beginning of year $4,457 $ — $329 $3,690 $ — $272
Actual return on plan assets 400 — 34 450 — 27
Employer contribution 327 13 56 555 25 74
Plan participants’ contributions ——29 ——26
Benefits paid (242) (13) (78) (240) (25) (70)
Foreign exchange impact 2——2 — —
Fair value of plan assets at end of year $4,944 $ — $370 $4,457 $ — $329
We seek to achieve the expected long-term rate of return
with a prudent level of risk given the benefit obligations
of the pension plans and their funded status. We target the
Cash Balance Plan’s asset allocation for a target mix range
of 40–70% equities, 20–50% fixed income, and approximately
10% in real estate, venture capital, private equity and other
investments. The target ranges employ a Tactical Asset
Allocation overlay, which is designed to overweight stocks
or bonds when a compelling opportunity exists. The Employee
Benefit Review Committee (EBRC), which includes several
members of senior management, formally reviews the
investment risk and performance of the Cash Balance Plan
on a quarterly basis. Annual Plan liability analysis and
periodic asset/liability evaluations are also conducted.
The weighted-average assumptions used to determine the
projected benefit obligation were:
Year ended December 31,
2005 2004
Pension Other Pension Other
benefits(1) benefits benefits(1) benefits
Discount rate 5.75% 5.75% 6.0%6.0%
Rate of compensation increase 4.0 — 4.0 —
The accumulated benefit obligation for the defined benefit
pension plans was $4,076 million and $3,786 million at
December 31, 2005 and 2004, respectively.
(in millions) December 31,
2005 2004
Pension benefits Pension benefits
Non- Other Non- Other
Qualified qualified benefits Qualified qualified benefits
Projected benefit obligation at beginning of year $3,777 $228 $751 $3,387 $202 $698
Service cost 208 21 21 170 23 17
Interest cost 220 14 41 215 13 43
Plan participants’ contributions ——29 ——26
Amendments 37 — (44) (54) (12) (1)
Actuarial gain (loss) 43 27 (12) 296 27 37
Benefits paid (242) (13) (78) (240) (25) (70)
Foreign exchange impact 2 — 1 3 — 1
Projected benefit obligation at end of year $4,045 $277 $709 $3,777 $228 $751
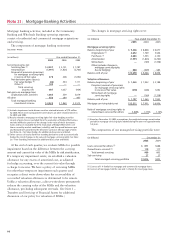
The changes in the projected benefit obligation during 2005 and 2004 and the amounts included in the Consolidated Balance
Sheet at December 31, 2005 and 2004, were:
(1) Includes both qualified and nonqualified pension benefits.
The changes in the fair value of plan assets during 2005 and 2004 were: