Wells Fargo 2005 Annual Report Download - page 101
Download and view the complete annual report
Please find page 101 of the 2005 Wells Fargo annual report below. You can navigate through the pages in the report by either clicking on the pages listed below, or by using the keyword search tool below to find specific information within the annual report.-
 1
1 -
2
-
3
-
4
-
5
-
6
-
7
-
8
-
9
-
10
-
11
-
12
-
13
-
14
-
15
-
16
-
17
-
18
-
19
-
20
-
21
-
22
-
23
-
24
-
25
-
26
-
27
-
28
-
29
-
30
-
31
-
32
-
33
-
34
-
35
-
36
-
37
-
38
-
39
-
40
-
41
-
42
-
43
-
44
-
45
-
46
-
47
-
48
-
49
-
50
-
51
-
52
-
53
-
54
-
55
-
56
-
57
-
58
-
59
-
60
-
61
-
62
-
63
-
64
-
65
-
66
-
67
-
68
-
69
-
70
-
71
-
72
-
73
-
74
-
75
-
76
-
77
-
78
-
79
-
80
-
81
-
82
-
83
-
84
-
85
-
86
-
87
-
88
-
89
-
90
-
 91
91 -
 92
92 -
 93
93 -
 94
94 -
 95
95 -
 96
96 -
 97
97 -
 98
98 -
 99
99 -
 100
100 -
 101
101 -
 102
102 -
 103
103 -
 104
104 -
 105
105 -
 106
106 -
 107
107 -
 108
108 -
 109
109 -
 110
110 -
 111
111 -
112
-
113
-
114
-
115
-
116
-
117
-
118
-
119
-
120
 |
 |

99
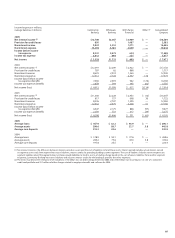
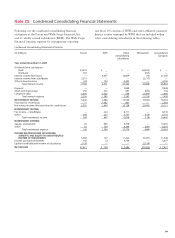
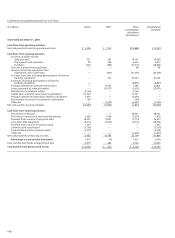
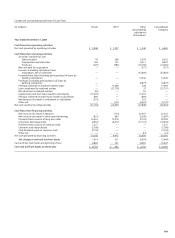
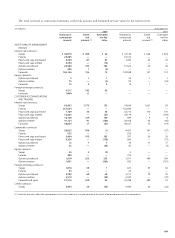
Note 22: Condensed Consolidating Financial Statements
Condensed Consolidating Statement of Income
(in millions) Parent WFFI Other Eliminations Consolidated
consolidating Company
subsidiaries
Year ended December 31, 2005
Dividends from subsidiaries:
Bank $4,675 $ —$ — $(4,675) $ —
Nonbank 763 —— (763) —
Interest income from loans — 4,467 16,809 (16) 21,260
Interest income from subsidiaries 2,215 — — (2,215) —
Other interest income 105 104 4,493 — 4,702
Total interest income 7,758 4,571 21,302 (7,669) 25,962
Deposits — — 3,848 —3,848
Short-term borrowings 256 223 897 (632) 744
Long-term debt 2,000 1,362 598 (1,094) 2,866
Total interest expense 2,256 1,585 5,343 (1,726) 7,458
NET INTEREST INCOME 5,502 2,986 15,959 (5,943) 18,504
Provision for credit losses —1,582 801 — 2,383
Net interest income after provision for credit losses 5,502 1,404 15,158 (5,943) 16,121
NONINTEREST INCOME
Fee income –nonaffiliates —224 8,111 — 8,335
Other 298 223 5,727 (138) 6,110
Total noninterest income 298 447 13,838 (138) 14,445
NONINTEREST EXPENSE
Salaries and benefits 92 985 9,378 — 10,455
Other 50 759 8,398 (644) 8,563
Total noninterest expense 142 1,744 17,776 (644) 19,018
INCOME BEFORE INCOME TAX EXPENSE
(BENEFIT) AND EQUITY IN UNDISTRIBUTED
INCOME OF SUBSIDIARIES 5,658 107 11,220 (5,437) 11,548
Income tax expense (benefit) 145 (2) 3,734 — 3,877
Equity in undistributed income of subsidiaries 2,158 — — (2,158) —
NET INCOME $7,671 $ 109 $ 7,486 $(7,595) $ 7,671
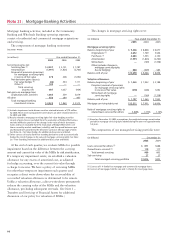
Following are the condensed consolidating financial
statements of the Parent and Wells Fargo Financial, Inc.
and its wholly-owned subsidiaries (WFFI). The Wells Fargo
Financial business segment for management reporting
(see Note 19) consists of WFFI and other affiliated consumer
finance entities managed by WFFI that are included within
other consolidating subsidiaries in the following tables.