Wells Fargo 2005 Annual Report Download - page 100
Download and view the complete annual report
Please find page 100 of the 2005 Wells Fargo annual report below. You can navigate through the pages in the report by either clicking on the pages listed below, or by using the keyword search tool below to find specific information within the annual report.-
 1
1 -
2
-
3
-
4
-
5
-
6
-
7
-
8
-
9
-
10
-
11
-
12
-
13
-
14
-
15
-
16
-
17
-
18
-
19
-
20
-
21
-
22
-
23
-
24
-
25
-
26
-
27
-
28
-
29
-
30
-
31
-
32
-
33
-
34
-
35
-
36
-
37
-
38
-
39
-
40
-
41
-
42
-
43
-
44
-
45
-
46
-
47
-
48
-
49
-
50
-
51
-
52
-
53
-
54
-
55
-
56
-
57
-
58
-
59
-
60
-
61
-
62
-
63
-
64
-
65
-
66
-
67
-
68
-
69
-
70
-
71
-
72
-
73
-
74
-
75
-
76
-
77
-
78
-
79
-
80
-
81
-
82
-
83
-
84
-
85
-
86
-
87
-
88
-
89
-
 90
90 -
 91
91 -
 92
92 -
 93
93 -
 94
94 -
 95
95 -
 96
96 -
 97
97 -
 98
98 -
 99
99 -
 100
100 -
 101
101 -
 102
102 -
 103
103 -
 104
104 -
 105
105 -
 106
106 -
 107
107 -
 108
108 -
 109
109 -
 110
110 -
111
-
112
-
113
-
114
-
115
-
116
-
117
-
118
-
119
-
120
 |
 |

98
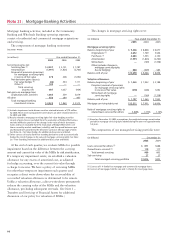
Mortgage banking activities, included in the Community
Banking and Wholesale Banking operating segments,
consist of residential and commercial mortgage originations
and servicing.
The components of mortgage banking noninterest
income were:
Note 21: Mortgage Banking Activities
(in millions) Year ended December 31,
2005 2004 2003
Servicing income, net:
Servicing fees (1) $ 2,457 $ 2,101 $ 1,787
Amortization (1,991) (1,826) (2,760)
Reversal of provision (provision)
for mortgage servicing rights
in excess of fair value 378 208 (1,092)
Net derivative gains (losses):
Fair value hedges (2) (46) 554 1,111
Other (3) 189 — —
Total servicing
income, net 987 1,037 (954)
Net gains on mortgage loan
origination/sales activities 1,085 539 3,019
All other 350 284 447
Total mortgage banking
noninterest income $ 2,422 $ 1,860 $ 2,512
At the end of each quarter, we evaluate MSRs for possible
impairment based on the difference between the carrying
amount and current fair value of the MSRs by risk stratification.
If a temporary impairment exists, we establish a valuation
allowance for any excess of amortized cost, as adjusted
for hedge accounting, over the current fair value through
a charge to income. We have a policy of reviewing MSRs
for other-than-temporary impairment each quarter and
recognize a direct write-down when the recoverability of
a recorded valuation allowance is determined to be remote.
Unlike a valuation allowance, a direct write-down permanently
reduces the carrying value of the MSRs and the valuation
allowance, precluding subsequent reversals. (See Note 1 –
Transfers and Servicing of Financial Assets for additional
discussion of our policy for valuation of MSRs.)
(in millions) Year ended December 31,
2005 2004 2003
Mortgage servicing rights:
Balance, beginning of year $ 9,466 $ 8,848 $ 6,677
Originations (1) 2,652 1,769 3,546
Purchases (1) 2,683 1,353 2,140
Amortization (1,991) (1,826) (2,760)
Write-down —(169) (1,338)
Other (includes changes in
mortgage servicing rights
due to hedging) 888 (509) 583
Balance, end of year $13,698 $ 9,466 $ 8,848
Valuation allowance:
Balance, beginning of year $ 1,565 $ 1,942 $ 2,188
Provision (reversal of provision)
for mortgage servicing rights
in excess of fair value (378) (208) 1,092
Write-down of mortgage
servicing rights —(169) (1,338)
Balance, end of year $ 1,187 $ 1,565 $ 1,942
Mortgage servicing rights, net $12,511 $ 7,901 $ 6,906
Ratio of mortgage servicing rights to
related loans serviced for others 1.44% 1.15% 1.15%
(in billions) December 31,
2005 2004
Loans serviced for others (1) $ 871 $688
Owned loans serviced (2) 118 117
Total owned servicing 989 805
Sub-servicing 27 27
Total managed servicing portfolio $1,016 $832
(1) Consists of 1-4 family first mortgage and commercial mortgage loans.
(2) Consists of mortgages held for sale and 1-4 family first mortgage loans.
(1) Based on December 31, 2005, assumptions, the weighted-average amortization
period for mortgage servicing rights added during the year was approximately
5.6 years.
(1) Includes impairment write-downs on other retained interests of $79 million
for 2003.There were no impairment write-downs on other retained interests
for 2005 and 2004.
(2) Results related to mortgage servicing rights fair value hedging activities
consist of gains (losses) excluded from the evaluation of hedge effectiveness
and the ineffective portion of the change in the value of these derivatives.
Gains and losses excluded from the evaluation of hedge effectiveness are
those caused by market conditions (volatility) and the spread between spot
and forward rates priced into the derivative contracts (the passage of time).
See Note 26 – Fair Value Hedges for additional discussion and detail.
(3) Other consists of results from free-standing derivatives used to economically
hedge the risk of changes in fair value of mortgage servicing rights. See Note
26 – Free-Standing Derivatives for additional discussion and detail.
The changes in mortgage servicing rights were:
The components of our managed servicing portfolio were: