Wells Fargo 2005 Annual Report Download - page 6
Download and view the complete annual report
Please find page 6 of the 2005 Wells Fargo annual report below. You can navigate through the pages in the report by either clicking on the pages listed below, or by using the keyword search tool below to find specific information within the annual report.-
 1
1 -
 2
2 -
 3
3 -
 4
4 -
 5
5 -
 6
6 -
 7
7 -
 8
8 -
 9
9 -
 10
10 -
 11
11 -
 12
12 -
 13
13 -
 14
14 -
 15
15 -
 16
16 -
 17
17 -
18
-
19
-
20
-
21
-
22
-
23
-
24
-
25
-
26
-
27
-
28
-
29
-
30
-
31
-
32
-
33
-
34
-
35
-
36
-
37
-
38
-
39
-
40
-
41
-
42
-
43
-
44
-
45
-
46
-
47
-
48
-
49
-
50
-
51
-
52
-
53
-
54
-
55
-
56
-
57
-
58
-
59
-
60
-
61
-
62
-
63
-
64
-
65
-
66
-
67
-
68
-
69
-
70
-
71
-
72
-
73
-
74
-
75
-
76
-
77
-
78
-
79
-
80
-
81
-
82
-
83
-
84
-
85
-
86
-
87
-
88
-
89
-
90
-
91
-
92
-
93
-
94
-
95
-
96
-
97
-
98
-
99
-
100
-
101
-
102
-
103
-
104
-
105
-
106
-
107
-
108
-
109
-
110
-
111
-
112
-
113
-
114
-
115
-
116
-
117
-
118
-
119
-
120
 |
 |

4
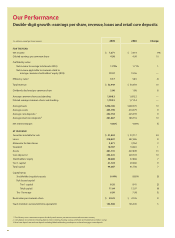
Our Performance
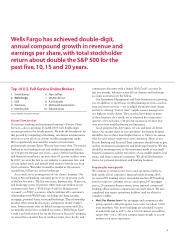
Double-digit growth: earnings per share, revenue,loans and retail core deposits
$ in millions, except per share amounts 2005 2004 Change
FOR THE YEAR
Net income $ 7,671 $ 7,014 9%
Diluted earnings per common share 4.50 4.09 10
Profitability ratios
Net income to average total assets (ROA) 1.72% 1.71% 1
Net income applicable to common stock to
average common stockholders’equity (ROE) 19.57 19.56 —
Efficiency ratio 157.7 58.5 (1)
Total revenue $ 32,949 $ 30,059 10
Dividends declared per common share 2.00 1.86 8
Average common shares outstanding 1,686.3 1,692.2 —
Diluted average common shares outstanding 1,705.5 1,713.4 —
Average loans $296,106 $269,570 10
Average assets 445,790 410,579 9
Average core deposits 2242,754 223,359 9
Average retail core deposits 3201,867 183,716 10
Net interest margin 4.86% 4.89% (1)
AT YEAR END
Securities available for sale $ 41,834 $ 33,717 24
Loans 310,837 287,586 8
Allowance for loan losses 3,871 3,762 3
Goodwill 10,787 10,681 1
Assets 481,741 427,849 13
Core deposits 2253,341 229,703 10
Stockholders’ equity 40,660 37,866 7
Tier 1 capital 31,724 29,060 9
Total capital 44,687 41,706 7
Capital ratios
Stockholders’ equity to assets 8.44% 8.85% (5)
Risk-based capital
Tier 1 capital 8.26 8.41 (2)
Total capital 11.64 12.07 (4)
Tier 1 leverage 6.99 7.08 (1)
Book value per common share $ 24.25 $ 22.36 8
Team members (active, full-time equivalent) 153,500 145,500 5
1 The efficiency ratio is noninterest expense divided by total revenue (net interest income and noninterest income).
2 Core deposits are noninterest-bearing deposits, interest-bearing checking, savings certificates and market rate and other savings.
3 Retail core deposits are total core deposits excluding Wholesale Banking core deposits and retail mortgage escrow deposits.