Wells Fargo 2005 Annual Report Download - page 108
Download and view the complete annual report
Please find page 108 of the 2005 Wells Fargo annual report below. You can navigate through the pages in the report by either clicking on the pages listed below, or by using the keyword search tool below to find specific information within the annual report.-
 1
1 -
2
-
3
-
4
-
5
-
6
-
7
-
8
-
9
-
10
-
11
-
12
-
13
-
14
-
15
-
16
-
17
-
18
-
19
-
20
-
21
-
22
-
23
-
24
-
25
-
26
-
27
-
28
-
29
-
30
-
31
-
32
-
33
-
34
-
35
-
36
-
37
-
38
-
39
-
40
-
41
-
42
-
43
-
44
-
45
-
46
-
47
-
48
-
49
-
50
-
51
-
52
-
53
-
54
-
55
-
56
-
57
-
58
-
59
-
60
-
61
-
62
-
63
-
64
-
65
-
66
-
67
-
68
-
69
-
70
-
71
-
72
-
73
-
74
-
75
-
76
-
77
-
78
-
79
-
80
-
81
-
82
-
83
-
84
-
85
-
86
-
87
-
88
-
89
-
90
-
91
-
92
-
93
-
94
-
95
-
96
-
97
-
 98
98 -
 99
99 -
 100
100 -
 101
101 -
 102
102 -
 103
103 -
 104
104 -
 105
105 -
 106
106 -
 107
107 -
 108
108 -
 109
109 -
 110
110 -
 111
111 -
 112
112 -
 113
113 -
 114
114 -
 115
115 -
 116
116 -
 117
117 -
 118
118 -
119
-
120
 |
 |

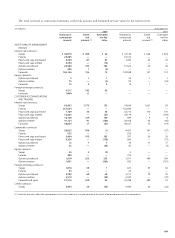
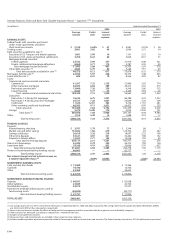
106
(in billions) To be well
capitalized under
the FDICIA
For capital prompt corrective
Actual adequacy purposes action provisions
Amount Ratio Amount Ratio Amount Ratio
As of December 31, 2005:
Total capital (to risk-weighted assets)
Wells Fargo & Company $44.7 11.64% >$30.7 >8.00%
Wells Fargo Bank, N.A. 34.7 11.04 > 25.2 >8.00 >$31.5 >10.00%
Tier 1 capital (to risk-weighted assets)
Wells Fargo & Company $31.7 8.26% >$15.4 >4.00%
Wells Fargo Bank, N.A. 25.2 8.01 > 12.6 >4.00 >$18.9 > 6.00%
Tier 1 capital (to average assets)
(Leverage ratio)
Wells Fargo & Company $31.7 6.99% >$18.1 >4.00%
(1)
Wells Fargo Bank, N.A. 25.2 6.61 > 15.3 >4.00
(1)
>$19.1 > 5.00%
(1) The leverage ratio consists of Tier 1 capital divided by quarterly average total assets, excluding goodwill and certain other items. The minimum leverage ratio guideline
is 3% for banking organizations that do not anticipate significant growth and that have well-diversified risk, excellent asset quality, high liquidity, good earnings,
effective management and monitoring of market risk and, in general, are considered top-rated, strong banking organizations.
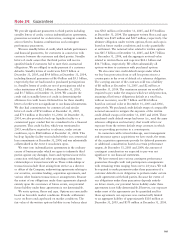
Note 25: Regulatory and Agency Capital Requirements
The Company and each of its subsidiary banks are subject to
various regulatory capital adequacy requirements administered
by the Federal Reserve Board (FRB) and the OCC, respectively.
The Federal Deposit Insurance Corporation Improvement
Act of 1991 (FDICIA) required that the federal regulatory
agencies adopt regulations defining five capital tiers for banks:
well capitalized, adequately capitalized, undercapitalized,
significantly undercapitalized and critically undercapitalized.
Failure to meet minimum capital requirements can initiate
certain mandatory and possibly additional discretionary
actions by regulators that, if undertaken, could have a
direct material effect on our financial statements.
Quantitative measures, established by the regulators to
ensure capital adequacy, require that the Company and each
of the subsidiary banks maintain minimum ratios (set forth
in the table below) of capital to risk-weighted assets. There
are three categories of capital under the guidelines. Tier 1
capital includes common stockholders’ equity, qualifying
preferred stock and trust preferred securities, less goodwill
and certain other deductions (including a portion of servicing
assets and the unrealized net gains and losses, after taxes,
on securities available for sale). Tier 2 capital includes preferred
stock not qualifying as Tier 1 capital, subordinated debt,
the allowance for credit losses and net unrealized gains on
marketable equity securities, subject to limitations by the
guidelines. Tier 2 capital is limited to the amount of Tier 1
capital (i.e., at least half of the total capital must be in the
form of Tier 1 capital). Tier 3 capital includes certain qualifying
unsecured subordinated debt.
We do not consolidate our wholly-owned trusts (the Trusts)
formed solely to issue trust preferred securities. The amount
of trust preferred securities issued by the Trusts that was
includable in Tier 1 capital in accordance with FRB risk-
based capital guidelines was $4.2 billion at December 31,
2005. The junior subordinated debentures held by the
Trusts were included in the Company’s long-term debt.
(See Note 12.)
Under the guidelines, capital is compared with the relative
risk related to the balance sheet. To derive the risk included
in the balance sheet, a risk weighting is applied to each
balance sheet asset and off-balance sheet item, primarily
based on the relative credit risk of the counterparty. For
example, claims guaranteed by the U.S. government or one
of its agencies are risk-weighted at 0% and certain real estate
related loans risk-weighted at 50%. Off-balance sheet items,
such as loan commitments and derivatives, are also applied
a risk weight after calculating balance sheet equivalent
amounts. A credit conversion factor is assigned to loan
commitments based on the likelihood of the off-balance
sheet item becoming an asset. For example, certain loan
commitments are converted at 50% and then risk-weighted
at 100%. Derivatives are converted to balance sheet
equivalents based on notional values, replacement costs
and remaining contractual terms. (See Notes 6 and 26 for
further discussion of off-balance sheet items.) For certain
recourse obligations, direct credit substitutes, residual
interests in asset securitization, and other securitized
transactions that expose institutions primarily to credit risk,
the capital amounts and classification under the guidelines
are subject to qualitative judgments by the regulators about
components, risk weightings and other factors.