Wells Fargo 2005 Annual Report Download - page 37
Download and view the complete annual report
Please find page 37 of the 2005 Wells Fargo annual report below. You can navigate through the pages in the report by either clicking on the pages listed below, or by using the keyword search tool below to find specific information within the annual report.-
 1
1 -
2
-
3
-
4
-
5
-
6
-
7
-
8
-
9
-
10
-
11
-
12
-
13
-
14
-
15
-
16
-
17
-
18
-
19
-
20
-
21
-
22
-
23
-
24
-
25
-
26
-
 27
27 -
 28
28 -
 29
29 -
 30
30 -
 31
31 -
 32
32 -
 33
33 -
 34
34 -
 35
35 -
 36
36 -
 37
37 -
 38
38 -
 39
39 -
 40
40 -
 41
41 -
 42
42 -
 43
43 -
 44
44 -
 45
45 -
 46
46 -
 47
47 -
48
-
49
-
50
-
51
-
52
-
53
-
54
-
55
-
56
-
57
-
58
-
59
-
60
-
61
-
62
-
63
-
64
-
65
-
66
-
67
-
68
-
69
-
70
-
71
-
72
-
73
-
74
-
75
-
76
-
77
-
78
-
79
-
80
-
81
-
82
-
83
-
84
-
85
-
86
-
87
-
88
-
89
-
90
-
91
-
92
-
93
-
94
-
95
-
96
-
97
-
98
-
99
-
100
-
101
-
102
-
103
-
104
-
105
-
106
-
107
-
108
-
109
-
110
-
111
-
112
-
113
-
114
-
115
-
116
-
117
-
118
-
119
-
120
 |
 |

35
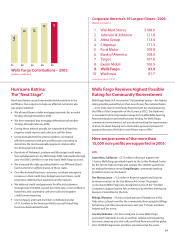
Our solid financial performance enables us to be one
of the top givers to non-profits among all U.S. companies.
We continued to have the only “Aaa” rated bank in the
U.S., the highest possible credit rating issued by Moody’s
Investors Service.
Our vision is to satisfy all the financial needs of our
customers, help them succeed financially, be recognized as
the premier financial services company in our markets and
be one of America’s great companies. Our primary strategy
to achieve this vision is to increase the number of products
our customers buy from us and to give them all the financial
products that fulfill their needs. Our cross-sell strategy and
diversified business model facilitate growth in strong and
weak economic cycles, as we can grow by expanding the
number of products our current customers have with us. At
year-end 2005, our average cross-sell set new records for the
Company – our average retail banking household now has
4.8 products with us, up from 4.6 a year ago and our average
Wholesale Banking customer now has a record 5.7 products.
Our goal is eight products per customer, which is currently
half of our estimate of potential demand.
Our core products grew this year:
• Average loans grew by 10%;
• Average retail core deposits grew by 10%
(average core deposits grew by 9%); and
• Assets managed and administered were up 11%.
We believe it is important to maintain a well controlled
environment as we continue to grow our businesses. We
manage our credit risk by maintaining prudent credit policies
for underwriting with effective procedures for monitoring and
review. We have a well diversified loan portfolio, measured
by industry, geography and product type. We manage the
interest rate and market risks inherent in our asset and liability
balances within prudent ranges, while ensuring adequate
liquidity and funding. Our stockholder value has increased
over time due to customer satisfaction, strong financial results,
investment in our businesses and the prudent way we attempt
to manage our business risks.
Our financial results included the following:
Net income in 2005 increased 9% to $7.7 billion from
$7.0 billion in 2004. Diluted earnings per common share
increased 10% to $4.50 in 2005 from $4.09 in 2004. Return
on average total assets was 1.72% and return on average
common equity was 19.57% in 2005, and 1.71% and
19.56%, respectively, in 2004.
Net interest income on a taxable-equivalent basis was
$18.6 billion in 2005, compared with $17.3 billion a year
ago, reflecting solid loan growth (other than ARMs) and a
relatively flat net interest margin. Average earning assets
grew 8% from a year ago, or 15% excluding 1-4 family first
mortgages. Our net interest margin was 4.86% for 2005,
compared with 4.89% in 2004. Given the prospect of higher
short-term interest rates and a flatter yield curve, beginning in
second quarter 2004, as part of our asset/liability management
strategy, we sold the lowest-yielding ARMs on our balance
sheet, replacing some of these loans with higher-yielding ARMs.
At the end of 2005, new ARMs being held for investment
within real estate 1-4 family mortgage loans had yields
more than 1% higher than the average yield on the ARMs
sold since second quarter 2004.
Noninterest income increased 12% to $14.4 billion in
2005 from $12.9 billion in 2004. Double-digit growth in
noninterest income was driven by growth across our busi-
nesses, with particular strength in trust, investment and IRA
fees, card fees, loan fees, mortgage banking income and
gains on equity investments.
Revenue, the sum of net interest income and noninterest
income, increased 10% to a record $32.9 billion in 2005
from $30.1 billion in 2004 despite balance sheet reposition-
ing actions, including losses from the sales of low-yielding
ARMs and debt securities. For the year, Wells Fargo Home
Mortgage (Home Mortgage) revenue increased $455 million,
or 10%, from $4.4 billion in 2004 to $4.9 billion in 2005.
Operating leverage improved during 2005 with revenue
growing 10% and noninterest expense up only 8%.
Noninterest expense was $19.0 billion in 2005, up 8%
from $17.6 billion in 2004, primarily due to increased
mortgage production and continued investments in new
stores and additional sales-related team members. Noninterest
expense also included a $117 million expense to adjust the
estimated lives for certain depreciable assets, primarily building
improvements, $62 million of airline lease write-downs,
$56 million of integration expense and $25 million for the
adoption of FIN 47. We began expensing stock options,
as required, on January 1, 2006. Taking into account our
February 2006 option grant, we anticipate that total stock
option expense will reduce earnings by approximately
$.06 per share for 2006.
During 2005, net charge-offs were $2.28 billion, or .77%
of average total loans, compared with $1.67 billion, or .62%,
during 2004. Credit losses for 2005 included $171 million of
incremental fourth quarter bankruptcy losses and increased
losses of $163 million for first quarter 2005 initial
implementation of conforming to more stringent FFIEC
charge-off timing rules at Wells Fargo Financial. The provision
for credit losses was $2.38 billion in 2005, up $666 million
from $1.72 billion in 2004. The 2005 provision for credit
losses also included $100 million for estimated credit losses
related to Hurricane Katrina. The allowance for credit losses,
which consists of the allowance for loan losses and the
reserve for unfunded credit commitments, was $4.06 billion,
or 1.31% of total loans, at December 31, 2005, compared
with $3.95 billion, or 1.37%, at December 31, 2004.
At December 31, 2005, total nonaccrual loans were
$1.34 billion, or .43% of total loans, down from $1.36 billion,
or .47%, at December 31, 2004. Foreclosed assets were
$191 million at December 31, 2005, compared with
$212 million at December 31, 2004.