Wells Fargo 2005 Annual Report Download - page 46
Download and view the complete annual report
Please find page 46 of the 2005 Wells Fargo annual report below. You can navigate through the pages in the report by either clicking on the pages listed below, or by using the keyword search tool below to find specific information within the annual report.-
 1
1 -
2
-
3
-
4
-
5
-
6
-
7
-
8
-
9
-
10
-
11
-
12
-
13
-
14
-
15
-
16
-
17
-
18
-
19
-
20
-
21
-
22
-
23
-
24
-
25
-
26
-
27
-
28
-
29
-
30
-
31
-
32
-
33
-
34
-
35
-
 36
36 -
 37
37 -
 38
38 -
 39
39 -
 40
40 -
 41
41 -
 42
42 -
 43
43 -
 44
44 -
 45
45 -
 46
46 -
 47
47 -
 48
48 -
 49
49 -
 50
50 -
 51
51 -
 52
52 -
 53
53 -
 54
54 -
 55
55 -
 56
56 -
57
-
58
-
59
-
60
-
61
-
62
-
63
-
64
-
65
-
66
-
67
-
68
-
69
-
70
-
71
-
72
-
73
-
74
-
75
-
76
-
77
-
78
-
79
-
80
-
81
-
82
-
83
-
84
-
85
-
86
-
87
-
88
-
89
-
90
-
91
-
92
-
93
-
94
-
95
-
96
-
97
-
98
-
99
-
100
-
101
-
102
-
103
-
104
-
105
-
106
-
107
-
108
-
109
-
110
-
111
-
112
-
113
-
114
-
115
-
116
-
117
-
118
-
119
-
120
 |
 |

44
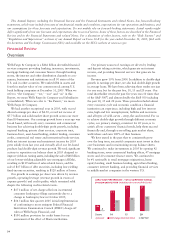
We earn trust, investment and IRA fees from managing and
administering assets, including mutual funds, corporate trust,
personal trust, employee benefit trust and agency assets. At
December 31, 2005, these assets totaled $783 billion, up 11%
from $705 billion at December 31, 2004. At December 31, 2004,
we acquired $24 billion in mutual fund assets and $5 billion
in institutional investment accounts from Strong Financial
Corporation (Strong Financial). When the Wells Fargo
Funds®and certain Strong Financial funds merged in April
2005, we renamed our mutual fund family the Wells Fargo
Advantage FundsSM. Generally, trust, investment and IRA
fees are based on the market value of the assets that are
managed, administered, or both. The increase in these fees
was due to additional revenue from the December 31, 2004,
acquisition of assets from the Strong Financial transaction
and our successful efforts to grow our investment businesses.
Also, we receive commissions and other fees for providing
services for retail and discount brokerage customers. At
December 31, 2005 and 2004, brokerage balances were
$97 billion and $86 billion, respectively. Generally, these
fees are based on the number of transactions executed at
the customer’s direction.
Card fees increased 19% to $1,458 million in 2005 from
$1,230 million in 2004, predominantly due to increases in credit
card accounts and credit and debit card transaction volume.
Mortgage banking noninterest income increased to
$2,422 million in 2005 from $1,860 million in 2004, due to
an increase in net gains on mortgage loan origination/sales
activities partly offset by the decline in net servicing income.
Net gains on mortgage loan origination/sales activities
were $1,085 million in 2005, up from $539 million in 2004,
primarily due to higher origination volume. Originations were
$366 billion in 2005 and $298 billion in 2004. The 1-4 family
first mortgage unclosed pipeline was $50 billion at both
year-end 2005 and 2004.
Net servicing income was $987 million in 2005 compared
with $1,037 million in 2004. Servicing income includes net
derivative gains and losses and is net of amortization and
impairment of MSRs, which are all influenced by both the
level and direction of mortgage interest rates. The Company’s
portfolio of loans serviced for others was $871 billion at
December 31, 2005, up 27% from $688 billion at year-end
2004. Given a larger servicing portfolio year over year,
the increase in servicing income was partly offset by higher
amortization of MSRs. Servicing fees increased to
$2,457 million in 2005 from $2,101 million in 2004 and
amortization of MSRs increased to $1,991 million in 2005
from $1,826 million in 2004. Servicing income in 2005
also included a higher MSRs valuation allowance release of
$378 million in 2005 compared with $208 million in 2004,
due to higher long-term interest rates in certain quarters
of 2005. The increase in fee revenue and the higher MSRs
valuation allowance release were mostly offset by the
decrease in net derivative gains to $143 million in 2005
from $554 million in 2004.
Net losses on debt securities were $120 million for 2005,
compared with $15 million for 2004. Net gains from equity
investments were $511 million in 2005, compared with
$394 million in 2004, primarily reflecting the continued
strong performance of our venture capital business.
We routinely review our investment portfolios and recognize
impairment write-downs based primarily on issuer-specific
factors and results, and our intent to hold such securities.
We also consider general economic and market conditions,
including industries in which venture capital investments
are made, and adverse changes affecting the availability of
venture capital. We determine impairment based on all of the
information available at the time of the assessment, but new
information or economic developments in the future could
result in recognition of additional impairment.
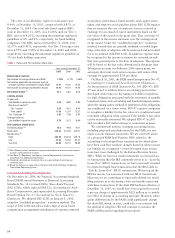
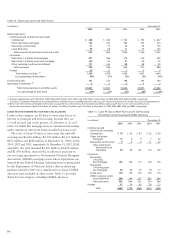
Noninterest Income
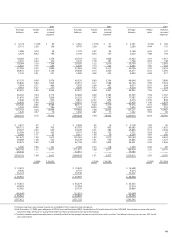
Table 4: Noninterest Income
(in millions) Year ended December 31,___% Change
2005 2004 2003 2005/ 2004/
2004 2003
Service charges on
deposit accounts $ 2,512
$ 2,417 $ 2,297 4% 5%
Trust and investment fees:
Trust, investment and IRA fees 1,855
1,509 1,345 23 12
Commissions and all other fees
581 607 592 (4) 3
Total trust and
investment fees
2,436 2,116 1,937 15 9
Card fees
1,458 1,230 1,079 19 14
Other fees:
Cash network fees
180 180 179 —1
Charges and fees on loans
1,022 921 756 11 22
All other
727 678 625 78
Total other fees
1,929 1,779 1,560 814
Mortgage banking:
Servicing income,net of amortization
and provision for impairment
987 1,037 (954) (5) —
Net gains on mortgage loan
origination/sales activities
1,085 539 3,019 101 (82)
All other
350 284 447 23 (36)
Total mortgage banking
2,422 1,860 2,512 30 (26)
Operating leases
812 836 937 (3) (11)
Insurance
1,215 1,193 1,071 211
Trading assets
571 523 502 94
Net gains (losses) on debt
securities available for sale
(120) (15) 4 700 —
Net gains from
equity investments
511 394 55 30 616
Net gains on sales of loans
511 28 (55) (61)
Net gains (losses) on dispositions
of operations
14 (15) 29 ——
All other
680 580 371 17 56
Total
$14,445 $12,909 $12,382 12 4