Wells Fargo 2005 Annual Report Download - page 72
Download and view the complete annual report
Please find page 72 of the 2005 Wells Fargo annual report below. You can navigate through the pages in the report by either clicking on the pages listed below, or by using the keyword search tool below to find specific information within the annual report.-
 1
1 -
2
-
3
-
4
-
5
-
6
-
7
-
8
-
9
-
10
-
11
-
12
-
13
-
14
-
15
-
16
-
17
-
18
-
19
-
20
-
21
-
22
-
23
-
24
-
25
-
26
-
27
-
28
-
29
-
30
-
31
-
32
-
33
-
34
-
35
-
36
-
37
-
38
-
39
-
40
-
41
-
42
-
43
-
44
-
45
-
46
-
47
-
48
-
49
-
50
-
51
-
52
-
53
-
54
-
55
-
56
-
57
-
58
-
59
-
60
-
61
-
 62
62 -
 63
63 -
 64
64 -
 65
65 -
 66
66 -
 67
67 -
 68
68 -
 69
69 -
 70
70 -
 71
71 -
 72
72 -
 73
73 -
 74
74 -
 75
75 -
 76
76 -
 77
77 -
 78
78 -
 79
79 -
 80
80 -
 81
81 -
 82
82 -
83
-
84
-
85
-
86
-
87
-
88
-
89
-
90
-
91
-
92
-
93
-
94
-
95
-
96
-
97
-
98
-
99
-
100
-
101
-
102
-
103
-
104
-
105
-
106
-
107
-
108
-
109
-
110
-
111
-
112
-
113
-
114
-
115
-
116
-
117
-
118
-
119
-
120
 |
 |

70
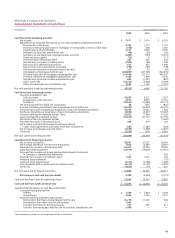
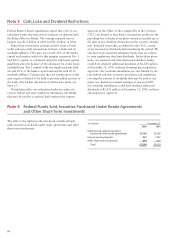
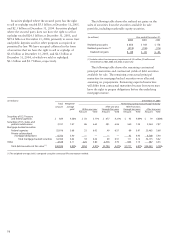
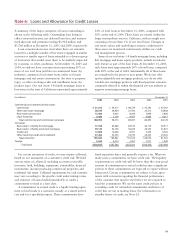
Note 4: Federal Funds Sold, Securities Purchased Under Resale Agreements
and Other Short-Term Investments
The table to the right provides the detail of federal funds
sold, securities purchased under resale agreements and other
short-term investments.
(in millions) December 31,
2005 2004
Federal funds sold and securities
purchased under resale agreements $3,789 $3,009
Interest-earning deposits 847 1,397
Other short-term investments 670 614
Total $5,306 $5,020
Federal Reserve Board regulations require that each of our
subsidiary banks maintain reserve balances on deposits with
the Federal Reserve Banks. The average required reserve
balance was $1.4 billion in 2005 and $1.2 billion in 2004.
Federal law restricts the amount and the terms of both
credit and non-credit transactions between a bank and its
nonbank affiliates. They may not exceed 10% of the bank’s
capital and surplus (which for this purpose represents Tier 1
and Tier 2 capital, as calculated under the risk-based capital
guidelines, plus the balance of the allowance for credit losses
excluded from Tier 2 capital) with any single nonbank affili-
ate and 20% of the bank’s capital and surplus with all its
nonbank affiliates. Transactions that are extensions of credit
may require collateral to be held to provide added security to
the bank. (For further discussion of risk-based capital, see
Note 25.)
Dividends paid by our subsidiary banks are subject to
various federal and state regulatory limitations. Dividends
that may be paid by a national bank without the express
Note 3: Cash, Loan and Dividend Restrictions
approval of the Office of the Comptroller of the Currency
(OCC) are limited to that bank’s retained net profits for the
preceding two calendar years plus retained net profits up to
the date of any dividend declaration in the current calendar
year. Retained net profits, as defined by the OCC, consist
of net income less dividends declared during the period. We
also have state-chartered subsidiary banks that are subject
to state regulations that limit dividends. Under those provi-
sions, our national and state-chartered subsidiary banks
could have declared additional dividends of $1,185 million
at December 31, 2005, without obtaining prior regulatory
approval. Our nonbank subsidiaries are also limited by cer-
tain federal and state statutory provisions and regulations
covering the amount of dividends that may be paid in any
given year. Based on retained earnings at year-end 2005,
our nonbank subsidiaries could have declared additional
dividends of $2,411 million at December 31, 2005, without
obtaining prior approval.