Wells Fargo 2005 Annual Report Download - page 59
Download and view the complete annual report
Please find page 59 of the 2005 Wells Fargo annual report below. You can navigate through the pages in the report by either clicking on the pages listed below, or by using the keyword search tool below to find specific information within the annual report.-
 1
1 -
2
-
3
-
4
-
5
-
6
-
7
-
8
-
9
-
10
-
11
-
12
-
13
-
14
-
15
-
16
-
17
-
18
-
19
-
20
-
21
-
22
-
23
-
24
-
25
-
26
-
27
-
28
-
29
-
30
-
31
-
32
-
33
-
34
-
35
-
36
-
37
-
38
-
39
-
40
-
41
-
42
-
43
-
44
-
45
-
46
-
47
-
48
-
 49
49 -
 50
50 -
 51
51 -
 52
52 -
 53
53 -
 54
54 -
 55
55 -
 56
56 -
 57
57 -
 58
58 -
 59
59 -
 60
60 -
 61
61 -
 62
62 -
 63
63 -
 64
64 -
 65
65 -
 66
66 -
 67
67 -
 68
68 -
 69
69 -
70
-
71
-
72
-
73
-
74
-
75
-
76
-
77
-
78
-
79
-
80
-
81
-
82
-
83
-
84
-
85
-
86
-
87
-
88
-
89
-
90
-
91
-
92
-
93
-
94
-
95
-
96
-
97
-
98
-
99
-
100
-
101
-
102
-
103
-
104
-
105
-
106
-
107
-
108
-
109
-
110
-
111
-
112
-
113
-
114
-
115
-
116
-
117
-
118
-
119
-
120
 |
 |

57
Comparison of 2004 with 2003
Net income in 2004 increased 13% to $7.0 billion from
$6.2 billion in 2003. Diluted earnings per common share
increased 12% to $4.09 in 2004 from $3.65 in 2003. In
addition to incremental investments in new stores, sales-
focused team members and technology, 2004 results included
$217 million ($.08 per share) of charitable contribution
expense for the Wells Fargo Foundation, $44 million ($.02
per share) for a special 401(k) contribution and $19 million
($.01 per share) in integration expense related to the Strong
Financial transaction. We also took significant actions to
reposition our balance sheet in 2004 designed to improve
earning asset yields and to reduce long-term debt costs. The
extinguishment of high interest rate debt reduced earnings by
$174 million ($.06 per share) for 2004. Return on average
assets was 1.71% and return on average common equity was
19.56% in 2004, up from 1.64% and 19.36%, respectively,
for 2003.
Net interest income on a taxable-equivalent basis was
$17.3 billion in 2004, compared with $16.1 billion in 2003,
an increase of 7%. The increase was primarily due to strong
consumer loan growth, especially in mortgage products. The
benefit of this growth was partially offset by lower loan yields
as new volumes were added below the portfolio average.
The net interest margin for 2004 decreased to 4.89%
from 5.08% in 2003. The decrease was primarily due to
lower investment portfolio yields following maturities and
prepayments of higher yielding mortgage-backed securities,
and the addition of new consumer and commercial loans
with yields below the existing portfolio average. These
factors were partially offset by the benefits of balance
sheet repositioning actions taken in 2004.
Noninterest income was $12.9 billion in 2004, compared
with $12.4 billion in 2003, an increase of 4%, driven by
growth across our business, with particular strength in trust,
investment and IRA fees, card fees, loan fees and gains on
equity investments.
Mortgage banking noninterest income was $1,860 million
in 2004, compared with $2,512 million in 2003. Net servicing
income was $1,037 million in 2004, compared with losses
of $954 million in 2003. The increase in net servicing income
in 2004, compared with 2003, reflected a reduction of
$934 million in amortization due to an increase in average
interest rates and higher gross servicing fees resulting from
growth in the servicing portfolio. In addition, to reflect the
higher value of our MSRs, we reversed $208 million of the
valuation allowance in 2004, compared with an impairment
provision of $1,092 million in 2003. Net derivative gains on
fair value hedges of our MSRs were $554 million and
$1,111 million in 2004 and 2003, respectively.
Net gains on mortgage loan origination/sales activities
were $539 million in 2004, compared with $3,019 million
for 2003. Lower gains in 2004 compared with 2003 reflected
lower origination volume and a decrease in margins, due
primarily to the increase in average interest rates and lower
consumer demand. Originations during 2004 declined to
$298 billion from $470 billion in 2003.
Revenue, the sum of net interest income and noninterest
income, increased 6% to a record $30.1 billion in 2004 from
$28.4 billion in 2003, despite a 37% decrease in mortgage
originations as the refinance driven market declined from its
exceptional 2003 level. Despite our balance sheet reposition-
ing actions in 2004, which reduced 2004 revenue growth by
approximately 1 percentage point due to the loss on sale of
lower yielding assets, and our significant level of investment
spending, operating leverage improved during 2004 with
revenue growing 6% and noninterest expense up only 2%.
For the year, Home Mortgage revenue declined $807 million,
or 16%, from $5.2 billion in 2003 to $4.4 billion in 2004.
Noninterest expense was $17.6 billion in 2004, compared
with $17.2 billion in 2003, an increase of 2%.
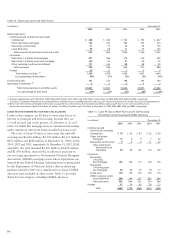
During 2004, net charge-offs were $1.67 billion, or
.62% of average total loans, compared with $1.72 billion,
or .81%, during 2003. The provision for credit losses was
$1.72 billion in 2004, flat compared with 2003. The allowance
for credit losses, which consists of the allowance for loan
losses and the reserve for unfunded credit commitments, was
$3.95 billion, or 1.37% of total loans, at December 31, 2004,
and $3.89 billion, or 1.54%, at December 31, 2003.
At December 31, 2004, total nonaccrual loans were
$1.36 billion, or .47% of total loans, down from $1.46 billion,
or .58%, at December 31, 2003. Foreclosed assets were
$212 million at December 31, 2004, compared with
$198 million at December 31, 2003.