Wells Fargo 2005 Annual Report Download - page 52
Download and view the complete annual report
Please find page 52 of the 2005 Wells Fargo annual report below. You can navigate through the pages in the report by either clicking on the pages listed below, or by using the keyword search tool below to find specific information within the annual report.-
 1
1 -
2
-
3
-
4
-
5
-
6
-
7
-
8
-
9
-
10
-
11
-
12
-
13
-
14
-
15
-
16
-
17
-
18
-
19
-
20
-
21
-
22
-
23
-
24
-
25
-
26
-
27
-
28
-
29
-
30
-
31
-
32
-
33
-
34
-
35
-
36
-
37
-
38
-
39
-
40
-
41
-
 42
42 -
 43
43 -
 44
44 -
 45
45 -
 46
46 -
 47
47 -
 48
48 -
 49
49 -
 50
50 -
 51
51 -
 52
52 -
 53
53 -
 54
54 -
 55
55 -
 56
56 -
 57
57 -
 58
58 -
 59
59 -
 60
60 -
 61
61 -
 62
62 -
63
-
64
-
65
-
66
-
67
-
68
-
69
-
70
-
71
-
72
-
73
-
74
-
75
-
76
-
77
-
78
-
79
-
80
-
81
-
82
-
83
-
84
-
85
-
86
-
87
-
88
-
89
-
90
-
91
-
92
-
93
-
94
-
95
-
96
-
97
-
98
-
99
-
100
-
101
-
102
-
103
-
104
-
105
-
106
-
107
-
108
-
109
-
110
-
111
-
112
-
113
-
114
-
115
-
116
-
117
-
118
-
119
-
120
 |
 |

50
LOANS 90 DAYS OR MORE PAST DUE AND STILL ACCRUING
Loans in this category are 90 days or more past due as to
interest or principal and still accruing, because they are
(1) well-secured and in the process of collection or (2) real
estate 1-4 family first mortgage loans or consumer loans exempt
under regulatory rules from being classified as nonaccrual.
The total of loans 90 days or more past due and still
accruing was $3,606 million, $2,578 million, $2,337 million,
$672 million and $698 million at December 31, 2005, 2004,
2003, 2002 and 2001, respectively. At December 31, 2005, 2004,
and 2003, the total included $2,923 million, $1,820 million
and $1,641 million, respectively, in advances pursuant to
our servicing agreements to Government National Mortgage
Association (GNMA) mortgage pools whose repayments are
insured by the Federal Housing Administration or guaranteed
by the Department of Veterans Affairs. Before clarifying
guidance issued in 2003 as to classification as loans, GNMA
advances were included in other assets. Table 11 provides
detail by loan category excluding GNMA advances.
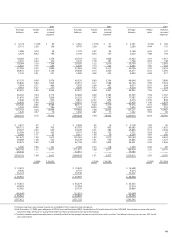
Table 11: Loans 90 Days or More Past Due and Still Accruing
(Excluding Insured/Guaranteed GNMA Advances)
(in millions) December 31,
2005 2004 2003 2002 2001
Commercial and
commercial real estate:
Commercial $18 $26 $87 $92 $60
Other real estate
mortgage 13 69 722
Real estate construction 9 6 611 47
Total commercial
and commercial
real estate 40 38 102 110 129
Consumer:
Real estate
1-4 family
first mortgage 103 148 117 104 145
Real estate
1-4 family junior
lien mortgage 50 40 29 18 17
Credit card 159 150 134 130 116
Other revolving credit
and installment 290 306 271 282 268
Total consumer 602 644 551 534 546
Foreign 41 76 43 28 23
Total $683 $758 $696 $672 $698
Table 10: Nonaccrual Loans and Other Assets
(in millions) December 31,
2005 2004 2003 2002 2001
Nonaccrual loans:
Commercial and commercial real estate:
Commercial $ 286 $ 345 $ 592 $ 796 $ 827
Other real estate mortgage 165 229 285 192 210
Real estate construction 31 57 56 93 145
Lease financing 45 68 73 79 163
Total commercial and commercial real estate 527 699 1,006 1,160 1,345
Consumer:
Real estate 1-4 family first mortgage 471 386 274 230 205
Real estate 1-4 family junior lien mortgage 144 92 87 49 22
Other revolving credit and installment 171 160 88 48 59
Total consumer 786 638 449 327 286
Foreign 25 21 3 5 9
Total nonaccrual loans (1) 1,338 1,358 1,458 1,492 1,640
As a percentage of total loans .43% .47% .58% .78% .98%
Foreclosed assets 191 212 198 195 160
Real estate investments (2) 2 2 6 4 2
Total nonaccrual loans and other assets $1,531 $1,572 $1,662 $1,691 $1,802
As a percentage of total loans .49% .55% .66% .88% 1.08%
(1) Includes impaired loans of $190 million, $309 million, $629 million, $612 million and $823 million at December 31, 2005, 2004, 2003, 2002 and 2001, respectively.
(See Note 1 (Summary of Significant Accounting Policies) and Note 6 (Loans and Allowance for Credit Losses) to Financial Statements for further discussion of impaired loans.)
(2) Real estate investments (contingent interest loans accounted for as investments) that would be classified as nonaccrual if these assets were recorded as loans.
Real estate investments totaled $84 million, $4 million, $9 million, $9 million and $24 million at December 31, 2005, 2004, 2003, 2002 and 2001, respectively.