Wells Fargo 2005 Annual Report Download - page 115
Download and view the complete annual report
Please find page 115 of the 2005 Wells Fargo annual report below. You can navigate through the pages in the report by either clicking on the pages listed below, or by using the keyword search tool below to find specific information within the annual report.-
 1
1 -
2
-
3
-
4
-
5
-
6
-
7
-
8
-
9
-
10
-
11
-
12
-
13
-
14
-
15
-
16
-
17
-
18
-
19
-
20
-
21
-
22
-
23
-
24
-
25
-
26
-
27
-
28
-
29
-
30
-
31
-
32
-
33
-
34
-
35
-
36
-
37
-
38
-
39
-
40
-
41
-
42
-
43
-
44
-
45
-
46
-
47
-
48
-
49
-
50
-
51
-
52
-
53
-
54
-
55
-
56
-
57
-
58
-
59
-
60
-
61
-
62
-
63
-
64
-
65
-
66
-
67
-
68
-
69
-
70
-
71
-
72
-
73
-
74
-
75
-
76
-
77
-
78
-
79
-
80
-
81
-
82
-
83
-
84
-
85
-
86
-
87
-
88
-
89
-
90
-
91
-
92
-
93
-
94
-
95
-
96
-
97
-
98
-
99
-
100
-
101
-
102
-
103
-
104
-
 105
105 -
 106
106 -
 107
107 -
 108
108 -
 109
109 -
 110
110 -
 111
111 -
 112
112 -
 113
113 -
 114
114 -
 115
115 -
 116
116 -
 117
117 -
 118
118 -
 119
119 -
 120
120
 |
 |

113
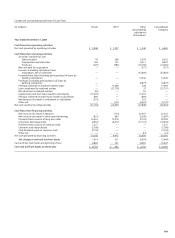
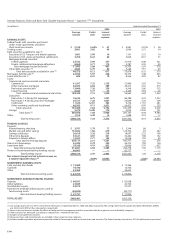
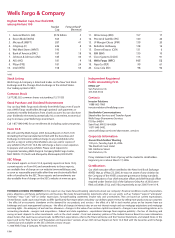
Quarterly Financial Data
Condensed Consolidated Statement of Income — Quarterly (Unaudited)
(in millions, except per share amounts) 2005 2004
Quarter ended Quarter ended
Dec. 31 Sept. 30 June 30 Mar. 31 Dec. 31 Sept. 30 June 30 Mar. 31
INTEREST INCOME $ 7,244 $ 6,645 $ 6,200 $ 5,873 $ 5,635 $ 5,405 $ 5,069 $ 4,858
INTEREST EXPENSE 2,405 1,969 1,664 1,420 1,179 987 843 808
NET INTEREST INCOME 4,839 4,676 4,536 4,453 4,456 4,418 4,226 4,050
Provision for credit losses 703 641 454 585 465 408 440 404
Net interest income after provision for credit losses 4,136 4,035 4,082 3,868 3,991 4,010 3,786 3,646
NONINTEREST INCOME
Service charges on deposit accounts 655 654 625 578 594 618 611 594
Trust and investment fees 623 614 597 602 543 508 530 535
Card fees 394 377 361 326 321 319 308 282
Other fees 478 520 478 453 479 452 437 411
Mortgage banking 628 743 237 814 790 262 493 315
Operating leases 200 202 202 208 211 207 209 209
Insurance 272 248 358 337 265 264 347 317
Net gains (losses) on debt securities available for sale (124) (31) 39 (4) 3 10 (61) 33
Net gains from equity investments 93 146 201 71 170 48 81 95
Other 434 354 231 251 336 212 245 306
Total noninterest income 3,653 3,827 3,329 3,636 3,712 2,900 3,200 3,097
NONINTEREST EXPENSE
Salaries 1,613 1,571 1,551 1,480 1,438 1,383 1,295 1,277
Incentive compensation 663 676 562 465 526 449 441 391
Employee benefits 428 467 432 547 451 390 391 492
Equipment 328 306 263 370 410 254 271 301
Net occupancy 344 354 310 404 301 309 304 294
Operating leases 161 159 157 158 164 158 156 155
Other 1,346 1,356 1,279 1,268 1,681 1,277 1,495 1,119
Total noninterest expense 4,883 4,889 4,554 4,692 4,971 4,220 4,353 4,029
INCOME BEFORE INCOME TAX EXPENSE 2,906 2,973 2,857 2,812 2,732 2,690 2,633 2,714
Income tax expense 976 998 947 956 947 942 919 947
NET INCOME $ 1,930 $ 1,975 $ 1,910 $ 1,856 $ 1,785 $ 1,748 $ 1,714 $ 1,767
EARNINGS PER COMMON SHARE $ 1.15 $ 1.17 $ 1.14 $ 1.09 $ 1.06 $ 1.03 $ 1.02 $ 1.04
DILUTED EARNINGS PER COMMON SHARE $ 1.14 $ 1.16 $ 1.12 $ 1.08 $ 1.04 $ 1.02 $ 1.00 $ 1.03
DIVIDENDS DECLARED PER COMMON SHARE $ .52 $ .52 $ .48 $ .48 $ .48 $ .48 $ .45 $ .45
Average common shares outstanding 1,675.4 1,686.8 1,687.7 1,695.4 1,692.7 1,688.9 1,688.1 1,699.3
Diluted average common shares outstanding 1,693.9 1,705.3 1,707.2 1,715.7 1,715.0 1,708.7 1,708.3 1,721.2
Market price per common share (1)
High $ 64.70 $ 62.87 $ 62.22 $ 62.75 $ 64.04 $ 59.86 $ 59.72 $ 58.98
Low 57.62 58.00 57.77 58.15 57.55 56.12 54.32 55.97
Quarter end 62.83 58.57 61.58 59.80 62.15 59.63 57.23 56.67
(1) Based on daily prices reported on the New York Stock Exchange Composite Transaction Reporting System.