Wells Fargo 2005 Annual Report Download - page 48
Download and view the complete annual report
Please find page 48 of the 2005 Wells Fargo annual report below. You can navigate through the pages in the report by either clicking on the pages listed below, or by using the keyword search tool below to find specific information within the annual report.-
 1
1 -
2
-
3
-
4
-
5
-
6
-
7
-
8
-
9
-
10
-
11
-
12
-
13
-
14
-
15
-
16
-
17
-
18
-
19
-
20
-
21
-
22
-
23
-
24
-
25
-
26
-
27
-
28
-
29
-
30
-
31
-
32
-
33
-
34
-
35
-
36
-
37
-
 38
38 -
 39
39 -
 40
40 -
 41
41 -
 42
42 -
 43
43 -
 44
44 -
 45
45 -
 46
46 -
 47
47 -
 48
48 -
 49
49 -
 50
50 -
 51
51 -
 52
52 -
 53
53 -
 54
54 -
 55
55 -
 56
56 -
 57
57 -
 58
58 -
59
-
60
-
61
-
62
-
63
-
64
-
65
-
66
-
67
-
68
-
69
-
70
-
71
-
72
-
73
-
74
-
75
-
76
-
77
-
78
-
79
-
80
-
81
-
82
-
83
-
84
-
85
-
86
-
87
-
88
-
89
-
90
-
91
-
92
-
93
-
94
-
95
-
96
-
97
-
98
-
99
-
100
-
101
-
102
-
103
-
104
-
105
-
106
-
107
-
108
-
109
-
110
-
111
-
112
-
113
-
114
-
115
-
116
-
117
-
118
-
119
-
120
 |
 |

46
Balance Sheet Analysis
Table 6: Mortgage-Backed Securities
(in billions) Fair Net unrealized Remaining
value gain (loss) maturity
At December 31, 2005 $32.4 $ .4 5.3 yrs.
At December 31, 2005,
assuming a 200 basis point:
Increase in interest rates 29.9 (2.1) 7.5 yrs.
Decrease in interest rates 33.5 1.5 2.0 yrs.
Table 8: Deposits
(in millions) December 31,%
2005 2004 Change
Noninterest-bearing $ 87,712 $ 81,082 8%
Interest-bearing checking 3,324 3,122 6
Market rate and
other savings 134,811 126,648 6
Savings certificates 27,494 18,851 46
Core deposits 253,341 229,703 10
Other time deposits 46,488 36,622 27
Deposits in foreign offices 14,621 8,533 71
Total deposits $314,450 $274,858 14
Table 7: Maturities for Selected Loan Categories
(in millions) December 31, 2005
Within After After Total
one one year five
year through years
fiveyears
Selected loan maturities:
Commercial $18,748 $31,627 $11,177 $ 61,552
Other real estate mortgage 3,763 11,777 13,005 28,545
Real estate construction 5,081 6,887 1,438 13,406
Foreign 525 3,995 1,032 5,552
Total selected loans $28,117 $54,286 $26,652 $109,055
Sensitivity of loans due after
one year to changes in
interest rates:
Loans at fixed interest rates $11,145 $ 7,453
Loans at floating/variable
interest rates 43,141 19,199
Total selected loans $54,286 $26,652
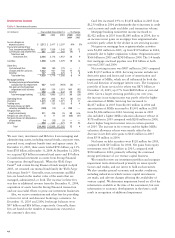
2005 from $32.3 billion in 2004, due to higher origination
volume. Residential mortgage originations of $366 billion
were up 23% from $298 billion in 2004. Loans held for
sale decreased to $612 million at December 31, 2005, from
$8.7 billion a year ago, due to the transfer of student loans
held for sale to the held for investment portfolio. Our decision
to hold these loans for investment was based on present yields
and our intent and ability to hold this portfolio for the
foreseeable future.
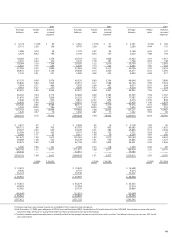
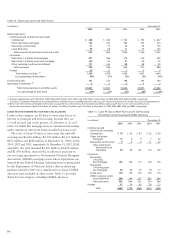
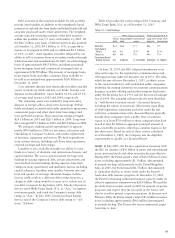
Table 7 shows contractual loan maturities and interest
rate sensitivities for selected loan categories.
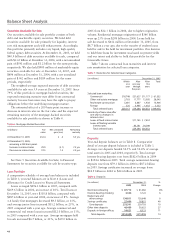
Deposits
Year-end deposit balances are in Table 8. Comparative
detail of average deposit balances is included in Table 3.
Average core deposits funded 54.5% and 54.4% of average
total assets in 2005 and 2004, respectively. Total average
interest-bearing deposits rose from $182.6 billion in 2004
to $194.6 billion in 2005. Total average noninterest-bearing
deposits rose from $79.3 billion in 2004 to $87.2 billion
in 2005. Savings certificates increased on average from
$18.9 billion in 2004 to $22.6 billion in 2005.
Securities Available for Sale
Our securities available for sale portfolio consists of both
debt and marketable equity securities. We hold debt
securities available for sale primarily for liquidity, interest
rate risk management and yield enhancement. Accordingly,
this portfolio primarily includes very liquid, high-quality
federal agency debt securities. At December 31, 2005, we held
$40.9 billion of debt securities available for sale, compared
with $33.0 billion at December 31, 2004, with a net unrealized
gain of $591 million and $1.2 billion for the same periods,
respectively. We also held $900 million of marketable equity
securities available for sale at December 31, 2005, and
$696 million at December 31, 2004, with a net unrealized
gain of $342 million and $189 million for the same
periods, respectively.
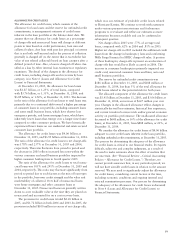
The weighted-average expected maturity of debt securities
available for sale was 5.9 years at December 31, 2005. Since
79% of this portfolio is mortgage-backed securities, the
expected remaining maturity may differ from contractual
maturity because borrowers may have the right to prepay
obligations before the underlying mortgages mature.
The estimated effect of a 200 basis point increase or
decrease in interest rates on the fair value and the expected
remaining maturity of the mortgage-backed securities
available for sale portfolio is shown in Table 6.
See Note 5 (Securities Available for Sale) to Financial
Statements for securities available for sale by security type.
Loan Portfolio
A comparative schedule of average loan balances is included
in Table 3; year-end balances are in Note 6 (Loans and
Allowance for Credit Losses) to Financial Statements.
Loans averaged $296.1 billion in 2005, compared with
$269.6 billion in 2004, an increase of 10%. Total loans at
December 31, 2005, were $310.8 billion, compared with
$287.6 billion at year-end 2004, an increase of 8%. Average
1-4 family first mortgages decreased $9.5 billion, or 11%,
and average junior liens increased $11.2 billion, or 25%, in
2005 compared with a year ago. Average commercial and
commercial real estate loans increased $12.0 billion, or 13%,
in 2005 compared with a year ago. Average mortgages held
for sale increased $6.7 billion, or 21%, to $39.0 billion in