Wells Fargo 2005 Annual Report Download - page 38
Download and view the complete annual report
Please find page 38 of the 2005 Wells Fargo annual report below. You can navigate through the pages in the report by either clicking on the pages listed below, or by using the keyword search tool below to find specific information within the annual report.-
 1
1 -
2
-
3
-
4
-
5
-
6
-
7
-
8
-
9
-
10
-
11
-
12
-
13
-
14
-
15
-
16
-
17
-
18
-
19
-
20
-
21
-
22
-
23
-
24
-
25
-
26
-
27
-
 28
28 -
 29
29 -
 30
30 -
 31
31 -
 32
32 -
 33
33 -
 34
34 -
 35
35 -
 36
36 -
 37
37 -
 38
38 -
 39
39 -
 40
40 -
 41
41 -
 42
42 -
 43
43 -
 44
44 -
 45
45 -
 46
46 -
 47
47 -
 48
48 -
49
-
50
-
51
-
52
-
53
-
54
-
55
-
56
-
57
-
58
-
59
-
60
-
61
-
62
-
63
-
64
-
65
-
66
-
67
-
68
-
69
-
70
-
71
-
72
-
73
-
74
-
75
-
76
-
77
-
78
-
79
-
80
-
81
-
82
-
83
-
84
-
85
-
86
-
87
-
88
-
89
-
90
-
91
-
92
-
93
-
94
-
95
-
96
-
97
-
98
-
99
-
100
-
101
-
102
-
103
-
104
-
105
-
106
-
107
-
108
-
109
-
110
-
111
-
112
-
113
-
114
-
115
-
116
-
117
-
118
-
119
-
120
 |
 |

36
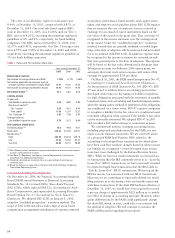
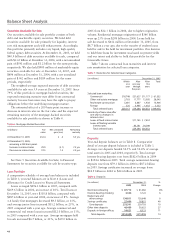
The ratio of stockholders’ equity to total assets was
8.44% at December 31, 2005, compared with 8.85% at
December 31, 2004. Our total risk-based capital (RBC)
ratio at December 31, 2005, was 11.64% and our Tier 1
RBC ratio was 8.26%, exceeding the minimum regulatory
guidelines of 8% and 4%, respectively, for bank holding
companies. Our RBC ratios at December 31, 2004, were
12.07% and 8.41%, respectively. Our Tier 1 leverage ratios
were 6.99% and 7.08% at December 31, 2005 and 2004,
respectively, exceeding the minimum regulatory guideline of
3% for bank holding companies.
stock plans, performance-based awards, stock appreciation
rights, and employee stock purchase plans. FAS 123R requires
that we measure the cost of employee services received in
exchange for an award of equity instruments based on the
fair value of the award on the grant date. That cost must be
recognized in the income statement over the vesting period
of the award. Under the “modified prospective” transition
method, awards that are granted, modified or settled begin-
ning at the date of adoption will be measured and accounted
for in accordance with FAS 123R. In addition, expense must
be recognized in the income statement for unvested awards
that were granted prior to the date of adoption. The expense
will be based on the fair value determined at the grant date.
Taking into account our February 2006 option grant, we
anticipate that total stock option expense will reduce 2006
earnings by approximately $.06 per share.
On March 30, 2005, the FASB issued Interpretation No. 47,
Accounting for Conditional Asset Retirement Obligations –
An Interpretation of FASB Statement No. 143 (FIN 47). FIN
47 was issued to address diverse accounting practices that
developed with respect to the timing of liability recognition
for legal obligations associated with the retirement of tangible
long-lived assets, such as building and leasehold improvements,
when the timing and/or method of settlement of the obligations
are conditional on a future event. FIN 47 requires companies
to recognize a liability for the fair value of a conditional asset
retirement obligation when incurred if the liability’s fair value
can be reasonably estimated. We adopted FIN 47 in 2005
and recorded a $25 million charge to noninterest expense.
We continuously monitor emerging accounting issues,
including proposed standards issued by the FASB, for any
impact on our financial statements. We are currently aware
of a proposed FASB Staff Position (FSP) related to the
accounting for leveraged lease transactions for which there
have been cash flow estimate changes based on when income
tax benefits are recognized. Certain leveraged lease transac-
tions have been challenged by the Internal Revenue Service
(IRS). While we have not made investments in a broad class
of transactions that the IRS commonly refers to as “Lease-In,
Lease-Out” (LILO) transactions, we have previously invested
in certain leveraged lease transactions that the IRS labels as
“Sale-In, Lease-Out” (SILO) transactions. We have paid the
IRS the income tax associated with our SILO transactions.
However, we are continuing to vigorously defend our initial
filing position as to the timing of the tax benefits associated
with these transactions. If the draft FSP had been effective at
December 31, 2005, we would have been required to record
a pre-tax charge of approximately $125 million as a cumula-
tive effect of change in accounting principle. However, subse-
quent deliberations by the FASB could significantly change
the draft FSP, which, in turn, could affect our estimate and
the method of adoption. We will continue to monitor the
FASB’s deliberations regarding this proposal.
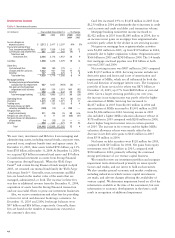
Table 1: Ratios and Per Common Share Data
Year ended December 31,
2005 2004 2003
PROFITABILITY RATIOS
Net income to average total assets (ROA) 1.72%
1.71% 1.64%
Net income applicable to common stock to
average common stockholders’ equity (ROE) 19.57
19.56 19.36
Net income to average stockholders’ equity 19.59
19.57 19.34
EFFICIENCY RATIO
(1)
57.7
58.5 60.6
CAPITAL RATIOS
At year end:
Stockholders’ equity to assets 8.44
8.85 8.89
Risk-based capital
(2)
Tier 1 capital 8.26
8.41 8.42
Total capital 11.64
12.07 12.21
Tier 1 leverage
(2)
6.99
7.08 6.93
Average balances:
Stockholders’ equity to assets 8.78
8.73 8.49
PER COMMON SHARE DATA
Dividend payout
(3)
44.0
44.8 40.7
Book value $24.25
$22.36 $20.31
Market price
(4)
High $64.70
$64.04 $59.18
Low 57.62
54.32 43.27
Year end 62.83
62.15 58.89
(1) The efficiency ratio is noninterest expense divided by total revenue (net interest
income and noninterest income).
(2) See Note 25 (Regulatory and Agency Capital Requirements) to Financial
Statements for additional information.
(3) Dividends declared per common share as a percentage of earnings per
common share.
(4) Based on daily prices reported on the New York Stock Exchange Composite
Transaction Reporting System.
Current Accounting Developments
On December 16, 2004, the Financial Accounting Standards
Board (FASB) issued Statement of Financial Accounting
Standards No. 123 (revised 2004), Share-Based Payment
(FAS 123R), which replaced FAS 123, Accounting for Stock-
Based Compensation, and superceded Accounting Principles
Board Opinion No. 25, Accounting for Stock Issued to
Employees. We adopted FAS 123R on January 1, 2006,
using the “modified prospective” transition method. The
scope of FAS 123R includes a wide range of stock-based
compensation arrangements including stock options, restricted