Wells Fargo 2005 Annual Report Download - page 64
Download and view the complete annual report
Please find page 64 of the 2005 Wells Fargo annual report below. You can navigate through the pages in the report by either clicking on the pages listed below, or by using the keyword search tool below to find specific information within the annual report.-
 1
1 -
2
-
3
-
4
-
5
-
6
-
7
-
8
-
9
-
10
-
11
-
12
-
13
-
14
-
15
-
16
-
17
-
18
-
19
-
20
-
21
-
22
-
23
-
24
-
25
-
26
-
27
-
28
-
29
-
30
-
31
-
32
-
33
-
34
-
35
-
36
-
37
-
38
-
39
-
40
-
41
-
42
-
43
-
44
-
45
-
46
-
47
-
48
-
49
-
50
-
51
-
52
-
53
-
 54
54 -
 55
55 -
 56
56 -
 57
57 -
 58
58 -
 59
59 -
 60
60 -
 61
61 -
 62
62 -
 63
63 -
 64
64 -
 65
65 -
 66
66 -
 67
67 -
 68
68 -
 69
69 -
 70
70 -
 71
71 -
 72
72 -
 73
73 -
 74
74 -
75
-
76
-
77
-
78
-
79
-
80
-
81
-
82
-
83
-
84
-
85
-
86
-
87
-
88
-
89
-
90
-
91
-
92
-
93
-
94
-
95
-
96
-
97
-
98
-
99
-
100
-
101
-
102
-
103
-
104
-
105
-
106
-
107
-
108
-
109
-
110
-
111
-
112
-
113
-
114
-
115
-
116
-
117
-
118
-
119
-
120
 |
 |

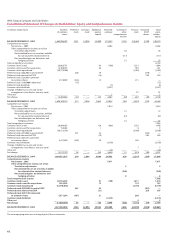
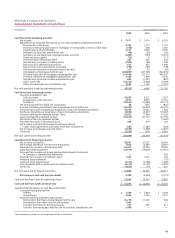
62
Wells Fargo & Company and Subsidiaries
Consolidated Statement of Changes in Stockholders’ Equity and Comprehensive Income
(in millions, except shares)
Number Preferred Common Additional Retained Cumulative Treasury Unearned Total
of common stock stock paid-in earnings other stock ESOP stock-
shares capital comprehensive shares holders’
income equity
BALANCE DECEMBER 31, 2002 1,685,906,507 $ 251 $ 2,894 $ 9,498 $ 19,355 $ 976 $ (2,465)$(190)$ 30,319
Comprehensive income
Net income – 2003 6,202 6,202
Other comprehensive income, net of tax:
Translation adjustments 26 26
Net unrealized losses on securities available
for sale and other retained interests (117) (117)
Net unrealized gains on derivatives and
hedging activities 53 53
Total comprehensive income 6,164
Common stock issued 26,063,731 63 (190) 1,221 1,094
Common stock issued for acquisitions 12,399,597 66 585 651
Common stock repurchased (30,779,500) (1,482) (1,482)
Preferred stock (260,200) issued to ESOP 260 19 (279) —
Preferred stock released to ESOP (16) 240 224
Preferred stock (223,660) converted
to common shares 4,519,039 (224) 13 211 —
Preferred stock (1,460,000) redeemed (73) (73)
Preferred stock dividends (3) (3)
Common stock dividends (2,527) (2,527)
Change in Rabbi trust assets and similar
arrangements (classified as treasury stock) 97 97
Other, net ___________ ____ ______ ______ 5 _____ ______ _____ 5
Net change 12,202,867 (37) — 145 3,487 (38) 632 (39) 4,150
BALANCE DECEMBER 31, 2003 1,698,109,374 214 2,894 9,643 22,842 938 (1,833) (229) 34,469
Comprehensive income
Net income – 2004 7,014 7,014
Other comprehensive income, net of tax:
Translation adjustments 12 12
Net unrealized losses on securities available
for sale and other retained interests (22) (22)
Net unrealized gains on derivatives and
hedging activities 22 22
Total comprehensive income 7,026
Common stock issued 29,969,653 129 (206) 1,523 1,446
Common stock issued for acquisitions 153,482 1 8 9
Common stock repurchased (38,172,556) (2,188) (2,188)
Preferred stock (321,000) issued to ESOP 321 23 (344) —
Preferred stock released to ESOP (19) 284 265
Preferred stock (265,537) converted
to common shares 4,531,684 (265) 29 236 —
Common stock dividends (3,150) (3,150)
Change in Rabbi trust assets and similar
arrangements (classified as treasury stock) 77
Other, net ______________ _____ _______ _______ (18)____ _ _ _________ ______ (18)
Net change (3,517,737) 56 — 163 3,640 12 (414) (60) 3,397
BALANCE DECEMBER 31, 2004 1,694,591,637 270 2,894 9,806 26,482 950 (2,247) (289) 37,866
Comprehensive income
Net income – 2005 7,671 7,671
Other comprehensive income, net of tax:
Translation adjustments 55
Net unrealized losses on securities available
for sale and other retained interests (298) (298)
Net unrealized gains on derivatives and
hedging activities 8 8
Total comprehensive income 7,386
Common stock issued 28,764,493 91 (198) 1,617 1,510
Common stock issued for acquisitions 1,954,502 12 110 122
Common stock repurchased (52,798,864) (3,159) (3,159)
Preferred stock (363,000) issued to ESOP 362 25 (387) —
Preferred stock released to ESOP (21) 328 307
Preferred stock (307,100) converted
to common shares 5,071,264 (307) 21 286 —
Common stock dividends (3,375) (3,375)
Other, net _____________ _____ ______ ______ ________ _____ 3 _____ 3
Net change (17,008,605) 55 — 128 4,098 (285) (1,143) (59) 2,794
BALANCE DECEMBER 31, 2005 1,677,583,032 $325 $2,894 $9,934 $30,580 $ 665 $(3,390) $(348) $40,660
The accompanying notes are an integral part of these statements.