Wells Fargo 2005 Annual Report Download - page 74
Download and view the complete annual report
Please find page 74 of the 2005 Wells Fargo annual report below. You can navigate through the pages in the report by either clicking on the pages listed below, or by using the keyword search tool below to find specific information within the annual report.-
 1
1 -
2
-
3
-
4
-
5
-
6
-
7
-
8
-
9
-
10
-
11
-
12
-
13
-
14
-
15
-
16
-
17
-
18
-
19
-
20
-
21
-
22
-
23
-
24
-
25
-
26
-
27
-
28
-
29
-
30
-
31
-
32
-
33
-
34
-
35
-
36
-
37
-
38
-
39
-
40
-
41
-
42
-
43
-
44
-
45
-
46
-
47
-
48
-
49
-
50
-
51
-
52
-
53
-
54
-
55
-
56
-
57
-
58
-
59
-
60
-
61
-
62
-
63
-
 64
64 -
 65
65 -
 66
66 -
 67
67 -
 68
68 -
 69
69 -
 70
70 -
 71
71 -
 72
72 -
 73
73 -
 74
74 -
 75
75 -
 76
76 -
 77
77 -
 78
78 -
 79
79 -
 80
80 -
 81
81 -
 82
82 -
 83
83 -
 84
84 -
85
-
86
-
87
-
88
-
89
-
90
-
91
-
92
-
93
-
94
-
95
-
96
-
97
-
98
-
99
-
100
-
101
-
102
-
103
-
104
-
105
-
106
-
107
-
108
-
109
-
110
-
111
-
112
-
113
-
114
-
115
-
116
-
117
-
118
-
119
-
120
 |
 |

72
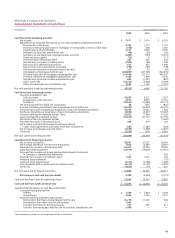
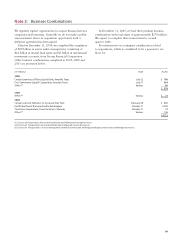
(in millions) December 31, 2005
Total Weighted- Remaining contractual principal maturity
amount average After one year After five years
yield Within one year through five years through ten years After ten years
Amount Yield Amount Yield Amount Yield Amount Yield
Securities of U.S. Treasury
and federal agencies $ 839 4.38% $ 50 5.11% $ 677 4.21% $ 93 4.69% $ 19 6.88%
Securities of U.S. states and
political subdivisions 3,191 7.57 86 6.63 281 6.06 560 7.25 2,264 7.87
Mortgage-backed securities:
Federal agencies 25,616 5.68 33 6.02 49 6.51 69 5.91 25,465 5.68
Private collateralized
mortgage obligations 6,750 5.40 — — — — 42 6.45 6,708 5.40
Total mortgage-backed securities 32,366 5.62 33 6.02 49 6.51 111 6.12 32,173 5.62
Other 4,538 6.11 225 5.80 2,773 5.70 953 7.13 587 6.53
Total debt securities at fair value (1) $40,934 5.80% $394 5.91% $3,780 5.47% $1,717 6.97% $35,043 5.78%
(1) The weighted-average yield is computed using the contractual life amortization method.
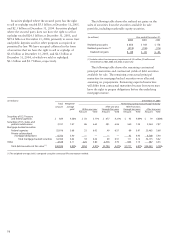
(in millions) Year ended December 31,
2005 2004 2003
Realized gross gains $ 355 $ 168 $ 178
Realized gross losses (1) (315) (108) (116)
Realized net gains $40 $60 $62
(1) Includes other-than-temporary impairment of $45 million, $9 million and
$50 million for 2005, 2004 and 2003, respectively.
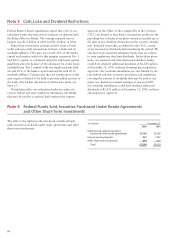
Securities pledged where the secured party has the right
to sell or repledge totaled $5.3 billion at December 31, 2005,
and $2.3 billion at December 31, 2004. Securities pledged
where the secured party does not have the right to sell or
repledge totaled $24.3 billion at December 31, 2005, and
$19.4 billion at December 31, 2004, primarily to secure trust
and public deposits and for other purposes as required or
permitted by law. We have accepted collateral in the form
of securities that we have the right to sell or repledge of
$3.4 billion at December 31, 2005, and $2.5 billion at
December 31, 2004, of which we sold or repledged
$2.3 billion and $1.7 billion, respectively.
The following table shows the remaining contractual
principal maturities and contractual yields of debt securities
available for sale. The remaining contractual principal
maturities for mortgage-backed securities were allocated
assuming no prepayments. Remaining expected maturities
will differ from contractual maturities because borrowers may
have the right to prepay obligations before the underlying
mortgages mature.
The following table shows the realized net gains on the
sales of securities from the securities available for sale
portfolio, including marketable equity securities.