Wells Fargo 2005 Annual Report Download - page 47
Download and view the complete annual report
Please find page 47 of the 2005 Wells Fargo annual report below. You can navigate through the pages in the report by either clicking on the pages listed below, or by using the keyword search tool below to find specific information within the annual report.-
 1
1 -
2
-
3
-
4
-
5
-
6
-
7
-
8
-
9
-
10
-
11
-
12
-
13
-
14
-
15
-
16
-
17
-
18
-
19
-
20
-
21
-
22
-
23
-
24
-
25
-
26
-
27
-
28
-
29
-
30
-
31
-
32
-
33
-
34
-
35
-
36
-
 37
37 -
 38
38 -
 39
39 -
 40
40 -
 41
41 -
 42
42 -
 43
43 -
 44
44 -
 45
45 -
 46
46 -
 47
47 -
 48
48 -
 49
49 -
 50
50 -
 51
51 -
 52
52 -
 53
53 -
 54
54 -
 55
55 -
 56
56 -
 57
57 -
58
-
59
-
60
-
61
-
62
-
63
-
64
-
65
-
66
-
67
-
68
-
69
-
70
-
71
-
72
-
73
-
74
-
75
-
76
-
77
-
78
-
79
-
80
-
81
-
82
-
83
-
84
-
85
-
86
-
87
-
88
-
89
-
90
-
91
-
92
-
93
-
94
-
95
-
96
-
97
-
98
-
99
-
100
-
101
-
102
-
103
-
104
-
105
-
106
-
107
-
108
-
109
-
110
-
111
-
112
-
113
-
114
-
115
-
116
-
117
-
118
-
119
-
120
 |
 |

45
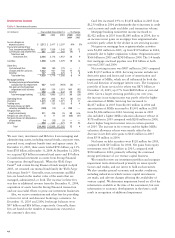
Noninterest expense in 2005 increased 8% to $19.0 billion
from $17.6 billion in 2004, primarily due to increased mort-
gage production and continued investments in new stores
and additional sales-related team members. Noninterest
expense in 2005 included a $117 million expense to adjust
the estimated lives for certain depreciable assets, primarily
building improvements, $62 million of airline lease write-
downs, $56 million of integration expense and $25 million
for the adoption of FIN 47, which relates to recognition
of obligations associated with the retirement of long-lived
assets, such as building and leasehold improvements. Home
Mortgage expenses increased $426 million from 2004,
reflecting higher production costs from an increase in loan
origination volume. For 2004, employee benefits included
a $44 million special 401(k) contribution and charitable
donations included a $217 million contribution to the
Wells Fargo Foundation.
See “Current Accounting Developments” for information
on accounting for share-based awards, such as stock option
grants. On January 1, 2006, we adopted FAS 123R, which
requires that we include the cost of such grants in our
income statement over the vesting period of the award.
Income Tax Expense
Our effective income tax rate for 2005 decreased to 33.57%
from 34.87% for 2004, due primarily to higher tax-exempt
income and income tax credits, and the tax benefit associated
with our donation of appreciated securities.
Noninterest Expense Operating Segment Results
Our lines of business for management reporting are Community
Banking, Wholesale Banking and Wells Fargo Financial.
For a more complete description of our operating segments,
including additional financial information and the underlying
management accounting process, see Note 19 (Operating
Segments) to Financial Statements.
COMMUNITY BANKING’S net income increased 13% to
$5.5 billion in 2005 from $4.9 billion in 2004. Total
revenue for 2005 increased 9%, driven by loan and deposit
growth and higher mortgage origination volumes. The
provision for credit losses for 2005 increased $108 million,
or 14%, reflecting incremental consumer bankruptcy filings
before the mid-October legislative reform. Noninterest
expense for 2005 increased $982 million, or 8%, driven
by mortgage production, growth in other businesses, and
investments in new stores, sales staff and technology.
Average loans were $187.0 billion in 2005, up 5% from
$178.9 billion in 2004.
WHOLESALE BANKING’S net income was a record $1.73 billion
in 2005, up 8% from $1.60 billion in 2004, driven largely
by a 15% increase in earning assets, as well as very low loan
losses. Average loans increased 17% to $62.2 billion in 2005
from $53.1 billion in 2004, with double-digit increases
across wholesale lending businesses. The provision for credit
losses decreased to $1 million in 2005 from $62 million in
2004, with loan charge-offs at very low levels throughout
2005. Noninterest income increased 13% to $3.4 billion
in 2005 from $3.0 billion in 2004, largely due to the
Strong Financial acquisition completed at the end of 2004.
Noninterest expense increased 16% to $3.17 billion in 2005
from $2.73 billion in 2004, due to the Strong Financial
acquisition and airline lease writedowns.
WELLS FARGO FINANCIAL’S net income decreased 34% to
$409 million in 2005 from $617 million in 2004. Net
income was reduced by incremental bankruptcies related
to the change in bankruptcy law and the $163 million first
quarter 2005 initial implementation of conforming to more
stringent FFIEC charge-off timing rules. Also, a $100 million
provision for credit losses was taken in third quarter 2005
for estimated losses from Hurricane Katrina. Total revenue
rose 12% in 2005, reaching $4.7 billion, compared with
$4.2 billion in 2004, due to higher net interest income.
Noninterest expense increased $202 million, or 9%, in 2005
from 2004, reflecting investments in new consumer finance
stores and additional team members.
Segment results for prior periods have been revised due
to the realignment of our automobile financing businesses
into Wells Fargo Financial in 2005, designed to leverage the
expertise, systems and resources of the existing businesses.
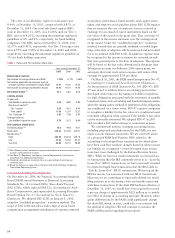
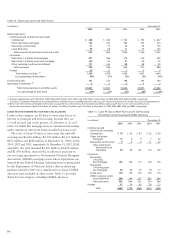
Table 5: Noninterest Expense
(in millions) Year ended December 31,_ _ % Change
2005 2004 2003 2005/ 2004/
2004 2003
Salaries $ 6,215 $ 5,393 $ 4,832 15% 12%
Incentive compensation 2,366 1,807 2,054 31 (12)
Employee benefits 1,874 1,724 1,560 911
Equipment 1,267 1,236 1,246 3(1)
Net occupancy 1,412 1,208 1,177 17 3
Operating leases 635 633 702 —(10)
Outside professional services 835 669 509 25 31
Contract services 596 626 866 (5) (28)
Travel and entertainment 481 442 389 914
Outside data processing 449 418 404 73
Advertising and promotion 443 459 392 (3) 17
Postage 281 269 336 4(20)
Telecommunications 278 296 343 (6) (14)
Insurance 224 247 197 (9) 25
Stationery and supplies 205 240 241 (15) —
Operating losses 194 192 193 1(1)
Security 167 161 163 4(1)
Core deposit intangibles 123 134 142 (8) (6)
Charitable donations 61 248 237 (75) 5
Net losses from debt
extinguishment 11 174 — (94) —
All other 901 997 1,207 (10) (17)
Total $19,018 $17,573 $17,190 82