Wells Fargo 2005 Annual Report Download - page 80
Download and view the complete annual report
Please find page 80 of the 2005 Wells Fargo annual report below. You can navigate through the pages in the report by either clicking on the pages listed below, or by using the keyword search tool below to find specific information within the annual report.-
 1
1 -
2
-
3
-
4
-
5
-
6
-
7
-
8
-
9
-
10
-
11
-
12
-
13
-
14
-
15
-
16
-
17
-
18
-
19
-
20
-
21
-
22
-
23
-
24
-
25
-
26
-
27
-
28
-
29
-
30
-
31
-
32
-
33
-
34
-
35
-
36
-
37
-
38
-
39
-
40
-
41
-
42
-
43
-
44
-
45
-
46
-
47
-
48
-
49
-
50
-
51
-
52
-
53
-
54
-
55
-
56
-
57
-
58
-
59
-
60
-
61
-
62
-
63
-
64
-
65
-
66
-
67
-
68
-
69
-
 70
70 -
 71
71 -
 72
72 -
 73
73 -
 74
74 -
 75
75 -
 76
76 -
 77
77 -
 78
78 -
 79
79 -
 80
80 -
 81
81 -
 82
82 -
 83
83 -
 84
84 -
 85
85 -
 86
86 -
 87
87 -
 88
88 -
 89
89 -
 90
90 -
91
-
92
-
93
-
94
-
95
-
96
-
97
-
98
-
99
-
100
-
101
-
102
-
103
-
104
-
105
-
106
-
107
-
108
-
109
-
110
-
111
-
112
-
113
-
114
-
115
-
116
-
117
-
118
-
119
-
120
 |
 |

78
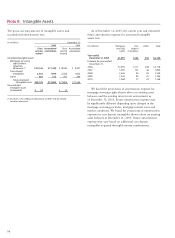
The gross carrying amount of intangible assets and
accumulated amortization was:
Note 8: Intangible Assets
We based the projections of amortization expense for
mortgage servicing rights shown above on existing asset
balances and the existing interest rate environment as
of December 31, 2005. Future amortization expense may
be significantly different depending upon changes in the
mortgage servicing portfolio, mortgage interest rates and
market conditions. We based the projections of amortization
expense for core deposit intangibles shown above on existing
asset balances at December 31, 2005. Future amortization
expense may vary based on additional core deposit
intangibles acquired through business combinations.
(in millions) December 31,
2005 2004
Gross Accumulated Gross Accumulated
carrying amortization carrying amortization
amount amount
Amortized intangible assets:
Mortgage servicing
rights, before
valuation
allowance (1) $ 25,126 $ 11,428 $ 18,903 $ 9,437
Core deposit
intangibles 2,432 1,943 2,426 1,823
Other 567 312 567 296
Total amortized
intangible assets $28,125 $13,683 $21,896 $11,556
Unamortized
intangible asset
(trademark) $14 $14
(1) See Note 21 for additional information on MSRs and the related
valuation allowance.
(in millions) Mortgage Core Other Total
servicing deposit
rights intangibles
Year ended
December 31, 2005 $1,991 $123 $55 $2,169
Estimate for year ended
December 31,
2006 $ 1,959 $111 $48 $ 2,118
2007 1,659 101 46 1,806
2008 1,426 93 30 1,549
2009 1,246 85 25 1,356
2010 1,068 77 23 1,168
As of December 31, 2005, the current year and estimated
future amortization expense for amortized intangible
assets was: