Wells Fargo 2005 Annual Report Download - page 45
Download and view the complete annual report
Please find page 45 of the 2005 Wells Fargo annual report below. You can navigate through the pages in the report by either clicking on the pages listed below, or by using the keyword search tool below to find specific information within the annual report.-
 1
1 -
2
-
3
-
4
-
5
-
6
-
7
-
8
-
9
-
10
-
11
-
12
-
13
-
14
-
15
-
16
-
17
-
18
-
19
-
20
-
21
-
22
-
23
-
24
-
25
-
26
-
27
-
28
-
29
-
30
-
31
-
32
-
33
-
34
-
 35
35 -
 36
36 -
 37
37 -
 38
38 -
 39
39 -
 40
40 -
 41
41 -
 42
42 -
 43
43 -
 44
44 -
 45
45 -
 46
46 -
 47
47 -
 48
48 -
 49
49 -
 50
50 -
 51
51 -
 52
52 -
 53
53 -
 54
54 -
 55
55 -
56
-
57
-
58
-
59
-
60
-
61
-
62
-
63
-
64
-
65
-
66
-
67
-
68
-
69
-
70
-
71
-
72
-
73
-
74
-
75
-
76
-
77
-
78
-
79
-
80
-
81
-
82
-
83
-
84
-
85
-
86
-
87
-
88
-
89
-
90
-
91
-
92
-
93
-
94
-
95
-
96
-
97
-
98
-
99
-
100
-
101
-
102
-
103
-
104
-
105
-
106
-
107
-
108
-
109
-
110
-
111
-
112
-
113
-
114
-
115
-
116
-
117
-
118
-
119
-
120
 |
 |

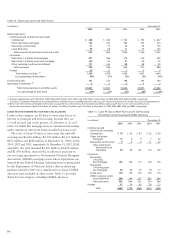
43
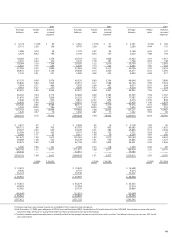
2003 2002 2001
Average Yields/ Interest Average Yields/ Interest Average Yields/ Interest
balance rates income/ balance rates income/ balance rates income/
expense expense expense
$ 4,174 1.16% $ 49 $ 2,961 1.73% $ 51 $ 2,741 3.72% $ 102
6,110 2.56 156 4,747 3.58 169 2,580 4.44 115
1,286 4.74 58 1,770 5.57 95 2,158 6.55 137
2,424 8.62 196 2,106 8.33 167 2,026 7.98 154
18,283 7.37 1,276 26,718 7.23 1,856 27,433 7.19 1,917
2,001 6.24 120 2,341 7.18 163 1,766 8.55 148
20,284 7.26 1,396 29,059 7.22 2,019 29,199 7.27 2,065
3,302 7.75 240 3,029 7.74 232 3,343 7.80 254
27,296 7.32 1,890 35,964 7.25 2,513 36,726 7.32 2,610
58,672 5.34 3,136 39,858 6.13 2,450 23,677 6.72 1,595
7,142 3.51 251 5,380 4.69 252 4,820 6.58 317
47,279 6.08 2,876 46,520 6.80 3,164 48,648 8.01 3,896
25,846 5.44 1,405 25,413 6.17 1,568 24,194 7.99 1,934
7,954 5.11 406 7,925 5.69 451 8,073 8.10 654
4,453 6.22 277 4,079 6.32 258 4,024 6.90 278
85,532 5.80 4,964 83,937 6.48 5,441 84,939 7.96 6,762
56,252 5.54 3,115 32,669 6.69 2,185 23,359 7.54 1,761
31,670 5.80 1,836 25,220 7.07 1,783 17,587 9.20 1,619
7,640 12.06 922 6,810 12.27 836 6,270 13.36 838
29,838 9.09 2,713 24,072 10.28 2,475 23,459 11.40 2,674
125,400 6.85 8,586 88,771 8.20 7,279 70,675 9.75 6,892
2,200 18.00 396 1,774 18.90 335 1,603 20.82 333
213,132 6.54 13,946 174,482 7.48 13,055 157,217 8.90 13,987
1,626 4.57 74 1,436 4.87 72 1,262 5.50 69
$318,152 6.16 19,502 $264,828 7.04 18,562 $229,023 8.24 18,795
$ 2,571 .27 7 $ 2,494 .55 14 $ 2,178 1.59 35
106,733 .66 705 93,787 .95 893 80,585 2.08 1,675
20,927 2.53 529 24,278 3.21 780 29,850 5.13 1,530
25,388 1.20 305 8,191 1.86 153 1,332 5.04 67
6,060 1.11 67 5,011 1.58 79 6,209 3.96 246
161,679 1.00 1,613 133,761 1.43 1,919 120,154 2.96 3,553
29,898 1.08 322 33,278 1.61 536 33,885 3.76 1,273
53,823 2.52 1,355 42,158 3.33 1,404 34,501 5.29 1,826
3,306 3.66 121 2,780 4.23 118 1,394 6.40 89
248,706 1.37 3,411 211,977 1.88 3,977 189,934 3.55 6,741
69,446 — — 52,851 — — 39,089 — —
$318,152 1.08 3,411 $264,828 1.51 3,977 $229,023 2.95 6,741
5.08% $16,091 5.53% $14,585 5.29% $12,054
$ 13,433 $ 13,820 $ 14,608
9,905 9,737 9,514
36,123 33,340 32,222
$ 59,461 $ 56,897 $ 56,344
$ 76,815 $ 63,574 $ 55,333
20,030 17,054 13,214
32,062 29,120 26,886
(69,446) (52,851) (39,089)
$ 59,461 $ 56,897 $ 56,344
$377,613 $321,725 $285,367
(5) Nonaccrual loans and related income are included in their respective loan categories.
(6) At December 31, 2003, upon adoption of FIN 46 (revised December 2003), Consolidation of Variable Interest Entities (FIN 46R), these balances were reflected in
long-term debt. See Note 12 (Long-Term Debt) to Financial Statements for more information.
(7) Includes taxable-equivalent adjustments primarily related to tax-exempt income on certain loans and securities. The federal statutory tax rate was 35% for all
years presented.